!" $%&'&()%*' +,-./ &0
$%-*.&123 4",*( 56()&"7
896 $":)1&";6",*' 4;<*%,3 *". =&,6",)*' 56>*1.3 &0 ?)")"(
!"#"$%"& ()**
Suggested Citation:
Kocian, M., Batker, D., Harrison-Cox, J. 2011. An Ecological Study of Ecuador's Intag Region: The Environmental Impacts and Potential Rewards of Mining. Earth Economics, Tacoma, WA.
V1.1
This study was conducted with the support of the Threshold Foundation, Seattle International
Foundation, and the Holly Hill Charitable Trust and with significant assistance from Paola
Castegnaro, Zachary Christin, Rowan Schmidt, Lola Paulina Flores, and Colin Arisman.
The authors would like to extend a warm thank you to our project partners for their valuable contributions to this report: Theodosis Theodosopoulos, Martin Stanley, Joshua Farley, Marlies Wierenga, Astia Roper-Batker, Jose Cueva, Mariana Walter, Sara Latorre Tomas and Fernando Espinosa. We would also like to thank our reviewers, Carlos Zorrilla, Fabian Sandoval, and Jonathan Kochmer; our editors, Leah Mitchell, Jeff Mitchell, and Briahna Taylor; and our translator, Natalia Fajardo.
This project would not have been possible without the initial support of DECOIN, a grassroots environmental organization devoted to conserving the unique biodiversity in the Intag area of northwestern Ecuador.
Earth Economics team members who assisted with this report include Kellen Hawley, Jonathan Roberts, Patrick Miller, Tedi Dickinson, Caleb Tomlinson, Greg Lund, Steven Rystrom, and Yvonne Snyder. We would also like to thank our Board of Directors: Joshua Reyneveld, Ingrid Rasch, David Cosman, and Joshua Farley for their continued passion and dedication to our work.
The authors are responsible for the content of this report.

Cover photo by Kevin Schafer Layout by Maya Kocian
©2011 by Earth Economics. Reproduction of this publication for educational or other non-commercial purposes is authorized without prior written permission from the copyright holder provided the source is fully acknowledged. Reproduction of this publication for resale or other commercial purposes is prohibited without prior written permission of the copyright holder.

This study was funded by the Threshold Foundation's Sustainable Planet Committee, whose mission is meeting the needs of people now without compromising the needs of future generations, and by the Seattle International Foundation, which exists to support research and advocacy in the U.S.
and developing countries, with an emphasis on disseminating findings to
policymakers, the media, academics focused on development, and to U.S.
development agencies and other stakeholders. Funding also came from 3$/ 4%..5
Hill Charitable Trust, a private foundation based in the United Kingdom whose
focus is to sponsor environmental and educational projects in several countries.
This project would not have been possible without the initial support of DECOIN,
a grassroots environmental organization that finds ways to conserve the unique
biodiversity in the Intag area of northwestern Ecuador.
ii
Executive Summary 6
![]() Part 1: Development in Intag 11
Part 1: Development in Intag 11
Overview 11
Economic Development Options 14
Alternative Development Vision 18
Choosing Between Development Alternatives 21
![]()
Part 2: Copper Extraction and Revenue 25
Copper 25
World Copper Production 25
Copper Extraction 27
Copper Production Costs 28
Copper Price Volatility 28
Selling Copper 30
Economic Estimates of Junin's Mineral Deposit 33
Open-Pit Mine Remediation and Compliance 34
![]()
Part 3: Ecosystem Services in Intag 37
Categories of Ecosystem Services 37
Local Perspectives 37
Ecosystem Service Descriptions and Examples 37
![]()
Part 4: Valuation Analysis of the Intag Region 59
Valuation Methodology 59
Intag Land Cover Class 60
Ecosystem Services Identified and Valued 63
High and Low Value Estimates by Land Cover Class 63
Summary of Results 67
![]()
Part 5: Implications and Recommendations 69
Investing in the Future 69
Decision-Making Support 69
Development of Funding Sources 71
Towards a Sustainable and Desirable Future 72
Next Steps 72
Conclusion 74
Photo Credits 76
Appendix A: Study Limitations 77
Appendix B: Key Ecological Economics Concepts 80
Appendix C: Value Transfer Studies Used by Land Cover Class 89
Appendix D: Ecosystem Service Valuation Studies 92
Appendix E: Ascendant Copper-Results of Check Assaying Program on Junin Property 95
Endnotes 97

List of Figures and Tables
Figure 1: Study Area 10
Table 1: Extractive Industry Impact on GDP 16
Table 2: Summary of Economic Arguments For and Against Mining 17
Table 3: Summary of Social Arguments For and Against Mining 18
Table 4: Current Tourist Attractions 20
Figure 2: Illustration of the difference between price and value. 22
Figure 3: Worldwide Copper Production in 2008 (metric tons) 26
Figure 4. Copper Processing 27
Figure 5: Real Prices for Copper, 1870-1997 29
Figure 6: Copper Prices since 1995 29
Figure 7: The Timing of the Quotation Pricing Between the Concentrate Producer and the Smelter
and Refiner. 31
Table 5: Cash Flows and Revenues from the Sale of Copper on a Shipment 32
Table 6: Junin Preliminary Revenue Estimates 34
Table 7: Examples of Remediation Costs 35
Table 8: List of 23 Ecosystem Services 38
Table 9: Methods for Primary Research in Ecosystem Service Valuation. 60
Figure 8: Map and Acreage of Intag Region by Land Cover Class 61
Table 10: Ecosystem Services Identified and Valued in Intag 62
Table 11: High and Low Estimates for Agricultural Lands 63
Table 12: High and Low Estimates for Bamboo 63
Table 13: High and Low Estimates for Cloud Forests 64
Table 14: High and Low Estimates for Pasture 64
Table 15: High and Low Estimates for Pasture and Agricultural 65
Table 16: High and Low Estimates for Native Andean Alpine Grassland 65
Table 17: High and Low Estimates for Rivers and Lakes 66
Table 18: Annual Ecosystem Service Value Flows for the Intag Region 66
Table 19: Present Value over 100 Years with Zero and Three Percent Discount Rates 67
iv

Table of Abbreviations
CO( Carbon Dioxide DOP Date of Production EE Earth Economics
EIS Environmental Impact Study ESV Ecosystem Service Valuation GDP Gross Domestic Product GHGs Greenhouse Gases
GIS Geographic Information System Ha Hectare
IUCN International Union for Conservation of Nature LME London Metal Exchange
M Meter
NGO Non-governmental Organization
PES Payment for Ecosystem Services
PV Present Value
Rcs Refining Charges
REDD Reducing Emissions from Deforestation and Forest Degradation
ROI Return on Investment
Tcs Treatment Charges
v
$@6%-,):6
+-;;*1/
The Intag region of Ecuador spans two of the world's 34 most biologically important areas. With diminishing oil reserves and an increasing demand for minerals from emerging economies, leaders in the provincial and national government are under tremendous pressure to expand state incomes through natural resource extraction.
Notably, a report carried out by the Japanese International Co-operation Agency (JICA) in 1998 estimates that Intag may have as much as 318 million tons of copper ore in the ground. Copper is in high demand worldwide and offers an attractive
opportunity to increase national incomes. Yet copper mining has significant downstream landscape and social costs which have often been excluded from mining economic analysis. More importantly, the majority of Intag's population have worked over a decade to develop and implement an alternative and prosperous vision of the region's economy, which does not include mining.
The following study examines the economic value of the region's unique natural goods, which include water, timber, and agricultural products, as well as
the services such as flood protection, drinking water filtration, local weather and climate stability, aesthetic value, and recreation. The objective is to examine
the viability of two development pathways: copper extraction and alternative eco-development. We also identify options for pursuing economic prosperity with practical development strategies that live within the physical limits of the local and global ecosystems, and are sustainable.
The ecosystem services examined in this report include climate stability, flood protection, drinking water purification and supply, wildlife habitat, pollination, soil erosion control, soil formation, biological control, nutrient cycling, raw materials, waste treatment, food production as well as aesthetic and recreational values. The forests of Intag include
lower montane humid forests, pre-montane forests and montane very humid forests. The seven land- cover types analyzed are: cloud forests, agricultural lands, pastures, mix of agricultural and pastures, rivers and lakes, native Andean alpine grasslands (paramo in Spanish), and native bamboo.
In our research, we found that 17 of 23 ecosystem services across the land-cover types in Intag provide the regional and national community an average
of $447 million in yearly benefits. These figures are based on cutting-edge economic analysis tools that were developed, in part, with a United States National Science Foundation grant.
One way of determining economic value is to estimate the asset value of the natural capital providing this annual flow of value. This is like comparing house payments (flow of value) to the market value of the house (asset value). The value of an asset can be estimated from the flow of benefits it provides. If
the natural capital of the Intag region were treated like an economic asset, the asset value of the natural systems would be an average of $15.5 billion at a three-percent discount rate, which recognizes the renewable nature of ecosystem services and that there will be people in the future benefiting from them.
It is becoming increasingly clear that economic sustainability relies on environmental sustainability. The loss of nature's bounty has real regional and global economic costs. The analysis of economic benefits of natural systems has advanced very rapidly
with the realization that natural systems are vital to the health and development of economies.
Economics is re-tooling for the 21st century with three essential goals: sustainability, justice, and economic 6&%1&/''. Sustainability requires living off the
natural systems in such a way that they can continue
to provide the goods and services they produce
indefinitely. Justice and rights are core democratic
values. Rights frame and help define economic value.
Economic progress provides a global approach to
sustainable economic growth, alleviates poverty, and
achieves social progress.
The value of the economic benefits the Intag region provides is enormous; indeed, it is priceless. The benefits provided are local, national and global. The economic value of the watershed is larger than its built economic assets or the underground minerals. This conclusion may be surprising given the price of copper in today's market, however, as this report illuminates, the social and environmental costs of copper extraction are much higher than the value of copper itself.
In Intag and elsewhere, economic progress depends on healthy communities, healthy people, and sustainable ecosystems, along with the political empowerment of local residents to choose and develop their own model of well-being. Development progress must be resilient to price fluctuations in single commodities and extend beyond the life of traditional extractive industries. Strategic investment in conservation, developing and enhancing the actual
and potential sustainable economic alternatives, along with finding ethical markets for the rich diversity of ecosystem goods and services is key to the long-term viability of this special region of Ecuador.
Ecuadorian leadership has critical investment decisions to make. The term "investment" describes the choices we make today to place resources for returns in the future. An economy is the product of previous decades of investment. Future generations will benefit or suffer from the choices made today.
This report provides several recommendations for stabilizing and promoting the social and economic conditions in Intag, which include the following:
Include ecosystem service valuations (ESV) to environmental impact assessments (EIA).
Initiate mapping and modeling of ecosystem services in the region.
Use ESV data to fund further region-specific service value transfer studies through local universities, and to implement broad changes in asset accounting practices.
Perform an initial analysis of a restoration and conservation funding mechanism, and work with local and regional stakeholders to further refine the sustainable plan to ensure ongoing funding and policy support for basin-scale restoration and conservation efforts.
Given mining's social, economic and environmental impacts in areas like Intag, it should be considered as a last resource for development.
Consider the creation of a special development area to ground the area's economy on Intag's exceptional water, forests and biodiversity resources.
The overall conclusion of the report is that economic development within the Intag region is best achieved by tapping the vast value that ecosystem goods and services provide and that this approach is aligned with the development vision of Intag communities.
Copper development will carry great costs. It is a risky venture dependent upon global economic trends
and pricing, and competition from well established and planned mines could undercut expected profits and tax revenues. In addition, mining is inherently unsustainable. One day, a large pile of mine tailings will be left and the mine closed. World Bank studies confirm that most often the benefits of mining accrue to few while the costs are borne by many and overall, extractive industry dependence is associated with economic decline.
The Intag region is blessed with a flow of benefits on the order of $447 million per year. This is sufficient to build a robust economy given advancement in agroecology, markets and the development of local
to international funding mechanisms. Well managed, the resources of the Intag region can provide for sustainable, equitable and prosperous development in the region and nation.
8

4",1&.-%,)&"
Economies need nature. Water, flood protection, recreation, minerals, materials, aesthetic value, and food are just a few among many services natural systems provide to the human economy. No economy, big or small, can function without nature's provision
of economic goods and services.
Placing a dollar value on nature's work is not commoditizing nature. Rather, it is recognizing value that is often lost if not counted. Nature is invaluable just as the life of a person is invaluable. Yet, people also receive pay for work, and we need to understand the full value of nature's work.
This report provides a comprehensive view of the economic value of Intag's natural systems. It aims to better inform Intag's community, local, regional, and national governments and mining companies of the economic and social impact of copper extraction and the economic value the natural systems provide.
Report Organization
This report should be used as a tool to help the decision-making process of Intag's development strategy, and is organized into five major sections:
in Intag. A discussion of regulatory framework and remediation is provided with case study examples.
creates a platform to advance an economics
approach to sustainable development and provides
recommendations based on the results.
An Ecological Study of Ecuador's Intag Region: The Environmental Impacts and Potential Rewards of Mining 9
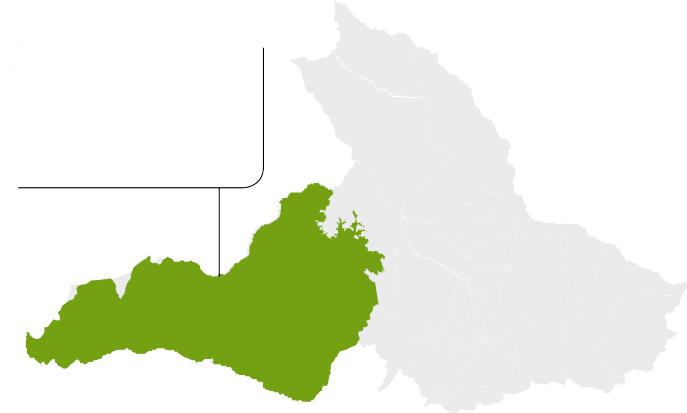
Figure 1: Study Area
Study Area: Intag and Manduriacos Region Area: 151,167 hectares
Province: Imbabura
Quito
Capital: Ibarra
One of 24 provinces in Ecuador
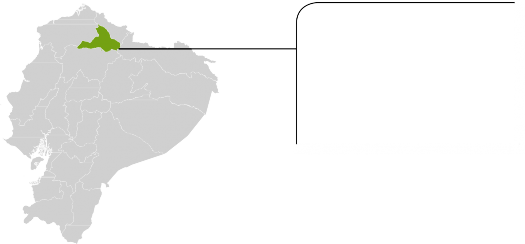
Country: Ecuador
Capital: Quito Population: 15,007,343
(July 2011 est.)

=*1, 4
Development in Intag

Section Summary: This section provides an overview of the geographic, historical, and current perspectives on economic development of the region, and summarizes the current legal framework for natural resource management.
Overview
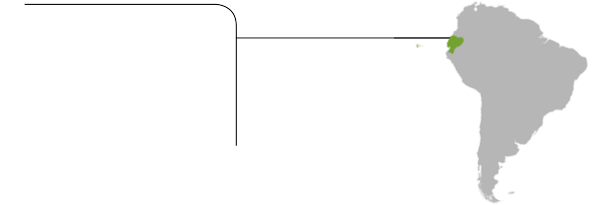
The Intag region is located in the Andes in the
Imbabura province of northern Ecuador, in the

confluence of two of the world's 34 most important
biological hotspots: the Tropical Andes hotspot and
the Tumbes-Choc6-Magdalena hotspot.- * Seven
parishes make up the Intag zone, an area totaling
150,000 hectares (ha). Here, approximately 17,000
people live in 76 sparsely scattered rural communities
where small-scale agriculture is the region's economic
base.

The region has been developing an eco-tourism economy and is home to fair-trade, shade-grown coffee plantations. The region's agriculture is self- sufficient and emerging into export markets. Local handicrafts are also entering new markets.
Geography
At an altitude of 650 to 4,000 meters (m), Intag/
Manduriacos mostly contains cloud forests and
agricultural lands.( Cloud forests make up no more
than 2.5 percent of the world's tropical forests.3
There are two types of mountainous forests in this
area: cloud forests, seasonal forests (moist forests
with deciduous trees).4 Tropical Montane Cloud
Forests are forested areas with frequent cloud and

mist present. Typically covered with orchids, mosses, and other plants on each branch.3 There are many species found in cloud forests that are not found elsewhere, therefore this ecosystem is known for containing a high incidence of endemic species. Cloud forests are fragile and threatened by climate change, logging and slash-and-burn agriculture.5 Many livelihoods worldwide are dependent on cloud forests, particularly for water supply.
The Esmeraldas watershed covers 20,000 square kilometers along its way to the Pacific Ocean. It is fed by rainwater as well as many tributaries sourced in

the Andean mountain range. The hydrographic system of the Esmeraldas River is formed by the Blanco, Guayllabamba, Toachi and Quininde rivers.
At the Esmeraldas River's mouth is the port City of Esmeraldas. The City is an important commercial center for the region's agricultural, oil, and lumber sectors. The land in the lower river basin is very fertile; plantains, cacao, coffee, banana, and tobacco are the dominant agricultural practices in this
region. The jungle in the lower and middle river basin provides an important source of lumber for the country. Traditionally, this is an important aspect of the province's economy. The river provides a way
![]()
- To qualify as a hotspot, a region must contain at least 1,500 native species of vascular plants (> 0.5 percent of the world's total), and
it has to have lost at least 70 percent of its original habitat. Collectively, hotspot areas support 44 percent of the world's plants and 35
percent of terrestrial vertebrates in an area that formerly covered only 11.8 percent of the planet's land surface. The habitat extent of
this land area had been reduced by 87.8 percent of its original extent, such that this wealth of biodiversity was restricted to only 1.4
percent of Earth's land surface. www.biodiversityhotspots.org.
of transporting forest products downstream into the city.6 The oil industry represents an important
economic activity for the region as well. Esmeraldas is the site of Ecuador's largest oil refinery with a capacity to process 110,000 barrels per day. It is the terminal
of the Trans-Ecuadorian Pipeline coming from the oil fields in northeastern Ecuador.
History
It is believed that the first settlers arrived in the
Intag region around 150 years ago. Archeological
discoveries, in Intag and the adjacent province of
Pichincha, provide ample evidence of the habitation
of the Yumbos, a pre-Incan people that made their
home in the area's cloud forests.7

In 1964, agrarian reform promoted the colonization of forestlands in Ecuador. Properties that had 80
percent forest coverage were deemed "unproductive" and could be occupied or expropriated under the reform laws. Colonizers and landowners were forced to deforest 50 percent of their land to prove that the earth was being put to a productive use.8

In addition to being an area rich in water resources, native forests, orchid and bird diversity, copper deposits were also discovered in the Intag area. In the 1990s, the Japanese company Bishi Metals explored and discovered copper deposits in the Intag's Toisan mountain range in northwest Ecuador. An estimated 318 million metric tons of copper ore, containing
2.26 million tons of pure copper are believed to lie in Intag's biodiverse forests and watersheds.9 The Japanese report reported that the impact to forests would be "massive deforestation" which would contribute to "desertification" to the local
climate. Local communities concerned about large- scale mining began uniting to request international support.*) Organizations including Asociaci6n Agroartesanal de Caficultores Rio Intag (AACRI), Mujer y Medio Ambiente, and Defensa y Conservaci6n Ecol6gica de Intag (DECOIN), are providing an alternative economic model to that of the extractive
model based on copper mining. Bishi Metals gave up the project in 1997 due to local opposition.
These grassroots organizations continued to develop national and international links, mobilize resources, and elaborate on practical proposals for alternatives

to mining.** Strong community organizing and support from NGOs led to the withdrawal of the company and the sale of the area to a Canadian mining company called Ascendant Copper Corporation.

In 2004, Ascendant Copper Corporation, now known as Copper Mesa, acquired a full mining concession to resume exploration activities. Their strategy was to raise enough capital to develop mining operations, which would create incentives to persuade local populations to depend on jobs created by the mine.*) But after several petitions from locals and instances of violent confrontations between anti-mining groups and paramilitary forces hired by the corporation, the Ministry of Mines and Petroleum ordered Ascendant to suspend all activities in September 2007.*( Following his election as the president of Ecuador, Rafael Correa cancelled Ascendant's concessions in Intag due to human rights violations.13
In 2010, the Toronto Stock Exchange (TSX) delisted Copper Mesa for "failure to meet the continued listing requirements of TSX." DECOIN worked for nearly
six years to address the human rights violations by the corporation. Copper Mesa's shares lost around 60 percent of their value within days of the TSX delisting.14
Constitutional Protection for Nature

Upon taking office, President Correa called for a
constitutional assembly to create a new constitution
for the country. A referendum was held for this
measure on April 15, 2007, and was approved with
just over 80 percent of the vote count. The Ecuadorian
Constituent Assembly was formed through democratic
elections held on September 30, 2007. The Ecuadorian
Constituent Assembly, initially led by Alberto
Acosta of Correa's PAIS Alliance, first convened on
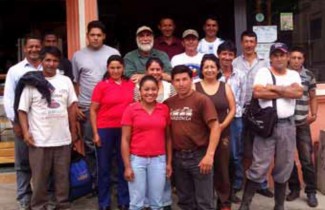
DECOIN members and supporters at their office in Apuela.
November 29, 2007, with a mandate to write the new constitution in six to eight months.15

The Constitution of 2008 is Ecuador's 20th constitution since its independence in 1830, and is noteworthy for being the first constitution in modern history to give rights to nature.16 This addition changed the legal status of nature from simply being property to being a rights-bearing entity in the
sense that humans are, and essentially provides a framework for sustainable development.17 The new constitution places Ecuador on the forefront of both international law and sustainable development.

The "Rights of Nature" section of the constitution begins with Article 71, stating: "Nature, or Pachamama, where life is reproduced and exists, has the right to exist, persist, maintain and regenerate its vital cycles, structure, functions and its processes in evolution."18 There will be challenges to enforce the law, as well as contradictory laws, such as the mining law, but it is still important that it exists.

In addition to the rights of nature, the entire section on rights in Article II of the Constitution is noteworthy for its thoroughness. The discussion is driven by
an important, sophisticated concept: Buen Vivir (in Spanish) or Sumak Kawsay (in Kichwa), variously translated as "Good Living" or "Living in Harmony."
Water Law
![]()
In Ecuador, as in most Latin American countries, water
is a national good for public use, with some exceptions
made for certain indigenous communities with
ancestral rights. The institutional structure pertaining
to water resources is complex, and includes a number
of institutions, regulations, and jurisdictions. In a
recent study, a prominent environmental lawyer
identified 25 laws and regulations as having direct
relevance and 11 institutions as having direct or
indirect jurisdiction over water resources.19 The
Water Law of 1972 is currently the primary legislation
governing water rights in Ecuador. Article 36

establishes a hierarchy of uses in which the highest
priority is provisioning for communities and wells;
followed by agricultural and cattle grazing practices;
and finally energy, industry, mining and other uses.

![]()
![]()
Since the approval of the 1972 water law, there have been a number of conflicts in defense of indigenous water rights. Because of this, one aim of the 2008 Constitution was to provide greater autonomy and legitimization to public and collective community water management, and to depart from neoliberal policies, which attempted to privatize water. The 2008 Constitution essentially recognizes water as a public good to be managed, for the most part, by the state and local community groups. Significantly, water rights are also given to nature. This was in recognition that natural systems are of intrinsic and economic value and require water to function. Water laws based on the 2008 Constitution will be expected to redistribute water rights more fairly and to meet critical social needs. However, at the time of this writing, the new water law is still being debated.
Mining Law
![]()
Ecuador is the only Andean Nation free of large-scale
metallic mining. Exploration by large multinationals
in Ecuador did not begin in earnest until the early

2000s, after a mining law was passed in 2000
that encouraged foreign corporations to explore
for minerals.() However, most mining activities
were suspended in April 2008 when the National
Constituent Assembly passed a mining decree that ordered the Ministry of Nonrenewable Natural Resources to revoke most mineral concessions for reasons such as failure to pay yearly fees to conserve their concessions, or because the concessions overlapped with protected natural areas or impacted sources of water. It is estimated that approximately half of Ecuador's peasant communities, specifically in rural areas, had been affected by mining concessions as of 2008.*) Current figures suggest that: "according to the Ministry of Energy and Mines, there are 1,990 registered mining concessions in the country, causing serious concerns among civil society, particularly campesinos and indigenous people."(* The mining decree also gave the government 180 days to
rewrite Ecuador's mining law.(( In January 2009, the Ecuadorian National Assembly passed a new mining law, which allowed a number of mining corporations to resume or begin operations.()
As a part of the mining law, the Mining Control and Regulation Agency is in charge of ensuring all
interested rights are met. As an institution of public rights they are allowed to supervise all mining actions and, if required, adopt administrative actions to safeguard the rightful exploitation, as well as social and environmental obligations appointed by law. Article 87 in the mining law states the rights
to information, participation, and consultation. The state government is responsible for executing all social participation and consultation processes using public institutions that correspond according to the constitutional rights and the effective norms. These actions have the objective to promote sustainable management within the mining activity, rationalizing the exploitation of the resource and maintaining

the communities' interest and support. In cases where the majority of the community is opposed to such mining activities, the Sectorial Ministry will handle the development decision. All mining
investors must respect the right to the communities' information, participation, and consultation regarding environmental management of all mining activities.

Indigenous and non-indigenous groups alike remain divided as to whether the new mining laws will result in net positive impacts for the people and natural environment of Ecuador.(( On December 31, 2009, Ecuador's first state mining company (ENAMI EP) was created by executive decree.
Economic Development Options
The Extractive Industry
![]()
Ecuadorian oil production peaked in 2006 and
has since been declining.23 With high-quality oil
reserves depleted, the Correa Administration began
considering mining for metals as a substantial source
for future state revenues. By 2007, the Ecuadorian
Ministry of Energy and Mines had granted licenses for
over 4,000 new mines.24

Economic Arguments For and Against Mining Mining was historically a crucial part of national development in many of today's wealthiest nations, and many believe that it can become an equally important sector in developing countries. Major arguments used to advocate for mining projects focus on economic development, including the following:
2-25 downstream jobs if suppliers, vendors, contractors, and others are included.25
to improvements in public infrastructure. For example, mining projects involve the transport of heavy equipment, which often requires the
construction of new roads or upgrades to existing roads.
will develop "value-added" sectors that ensure a greater proportion of downstream mining revenue is retained within the country. Value-added products can include copper wiring or copper piping, which are typically sold for a greater profit margin than copper ore.

With the experience of the last decade, however, there is accumulating evidence that mining has slowed development and caused substantial long- term damaging impacts. This has spurred increasing
debate over whether mining projects really support, or hinder, development.26 The World Bank has produced several reports that document the negative effects

of mining, although, as of this writing, it continues to support the mining sector as part of the solution to poverty reduction. Major arguments used to advocate against mining projects focus on sustainable economic development, including the following:
particles that can be blown towards nearby residents. In a 2010 study, actinolite in copper mining tailings was correlated with higher rates of pulmonary disorders such as mesothelioma.27 Pollutants such as lead (Pb) are also emitted as
a result of the mining process. For example, the copper smelters in La Oroya, Peru emitted 1,077 cubic meters of gas per second in 2000, which equaled more than 44,000 kg of lead per month.28
Mine Drainage" refers to the outflow of acidic
water from (usually abandoned) metal or coal
mines. The impacts of acid mine drainage can
last for hundreds of years, affecting multiple
generations.29 The waste produced from the
mining process, known as tailings could contain
high concentrations of lead, cadmium, zinc, sulfur,
arsenic, and manganese. Also, sulfide-bearing
minerals found in the parent rock, when exposed
to air and water, change sulfide (S2-) to sulfuric
acid (H(SO4), which is a clear, colorless, odorless, viscous liquid that is very corrosive. The pH of
water outflow from a copper mine can be highly acidic-measured at 2.77 on average in one study, compared with a typical pH level range of 5.5-7.5 for freshwater.30
leach into the groundwater.31 Additionally, a common occurrence in deep open-pit mines is the accumulation of ground water from the surrounding land, thus drying up streams and
underground water systems downstream of the mine.
similar to Intag, are still struggling to recover
their economy after a mine tailings spill in 1996.33
In Kolontar, the toxic red mud that spilled from
an alumina tailings reservoir into the Hungarian
countryside in October 2010 could make the soil
too salty for plants to grow well into the next
millennium.34
operations, such as open-pit mining, can impact

a region's climate. Tree removal changes the
moisture content of the atmosphere above the
local area. This change can break the cycle of
rainfall and transpiration, reducing rainfall and
drying out the local area. Desertification is the
process by which fertile land becomes desert,
typically caused by deforestation. The 1996
Japanese environmental impact assessment for
the Junin proposed mine forecasted "massive
deforestation which would progress to dry
conditions (desertification) influencing the local
climate..."
endeavor. Chile, for example, allocates a total of
33 percent of its energy to the mining industry
in the country.35 Although Ecuador has no
large-scale mining operations, it is no stranger
to energy shortages. In 2009, low water levels
caused an energy crisis which disrupted cities
throughout the country.36 Large-scale mining
requires enormous amounts of electricity for
moving overburden. Dams dedicated to mines are
often developed at the cost of taxpayers, while
the mine competes with residential and business
consumers for scarce power.
A World Bank independent review of extractive
industries in 48 countries where mining is greater
than 5 percent of all exports found the average GDP
growth per capita was negative between the years

of 1990 and 1999.26 Furthermore, this study showed
that average growth rates were inversely associated
with a country's reliance on mineral exports. Table 1
summarizes the study findings.
Table 1: Extractive Industry Impact on GDP 78
Countries with Extractive Industries | Change in average GDP per capita (1990-1999) |
>50% of all exports | -2.3% (negative) |
15–50% of all exports | -1.1% (negative) |
6–15% of all exports | -0.7% (negative) |

Reliance on extraction exposes nations and mining
communities to a number of economic vulnerabilities
and risks.37 If a country's economy is not sufficiently
diversified, it will more likely be subject to global
economic shocks and downturns, particularly
associated with mineral prices. With these downturns,
the poor are especially vulnerable. For example,
Zambia has lost more than 8,500 mining jobs since
2008 as a result of falling commodity prices and
the global economic downturn.38 The country relies
heavily on copper mining, which comprises 80 percent
of its export earnings. Because government income
is disproportionately dependent on mining royalties,
health, education, transportation, and public safety
expenditures fall when mineral prices fall. This
exposes the vulnerability of an economy based on
mining. In response to declining copper revenues,
Zambia is now investing more in energy infrastructure,
agriculture, and tourism.
Often economic decisions require making trade- offs. Table 2 provides a summary of the economic arguments for and against mining. The following section provides a summary of the socio-economic impacts of mining.
![]()
Table 2: Summary of Economic Arguments For and Against Mining
Economic Arguments (for mining) | Economic Arguments (against mining) | ||
| Job creation | | Surface water |
| Revenue generation | pollution | |
| Technology transfer Infrastructure development Downstream industry creation | | Volatile waste creation Costs of using police and public security forces Potential |
groundwater | |||
contamination | |||
| Impact on fish, | ||
shellfish, and | |||
agricultural | |||
production | |||
| High cost of | ||
remediation | |||
| Adverse relationship | ||
to genuine progress | |||
| Dependency on | ||
mineral prices | |||
| Widespread | ||
deforestation | |||
| Energy Needs | ||
Social Impacts of Mining

Although mining can bring prosperity in theory,
empirical evidence suggests that mining is more
likely to lead to greater poverty rates. Countries that
have invested most heavily in extractive industries
have tended to perform poorly by World Bank

development measures.26 Often countries with large
extractive industries have wide income gaps between
rich and poor, which impacts a large number of socio-
economic factors. Two articles that explore this issue

in detail include the 2001 World Bank study, Mining and Poverty Reduction, and later, Scott Pegg's 2006 article in the Journal of Cleaner Production, Mining
and Poverty Reduction: Transforming Rhetoric into Reality.
![]()
Key social impacts from mining include:

high prevalence of human immunodeficiency virus (HIV) and other communicable diseases in mining communities."25

the effective real income of local people, thereby contributing to increased poverty. The influx of workers, not all of whom find employment, can also create social tensions and conflict.25


industries such as agriculture) is highly correlated with corruption.41 A study corroborates and extends these results: non-fuel minerals (such as copper) in particular have anti-democratic effects on nations.37
![]()
Table 3: Summary of Social Arguments For and Against Mining
Social Arguments (for mining) | Social Arguments (against mining) | ||
| Job creation | | Increased poverty Increased disease Rising inflation Relocation Domestic unrest and corruption |
Alternative Development Vision
Over the years, the Intag community has put a great
deal of effort into developing economic alternatives
in order to move forward collectively in a sustainable
manner. Many groups have been established to
create forums of democratic, grassroots decision-
making based on their vision for the region. In 1996,
the county of Cotacachi elected Auki Tituana as the
new mayor. Under Tituana's policy, civil society in
Intag and the rest of the County of Cotacachi was able
to push through the Cotacachi Ecological Ordinance,
which declared Cotacachi an "ecological county."42
The following is a preliminary accounting of some of
the economic activities currently taking place as well
as some potential ideas for future activities. These
counteract arguments proposing the economic need
for extractive industries. It should be noted that there
are environmental costs of these activities as well, and
those costs should be considered by the community.
Subsistence Agriculture
Intag is a very steep, mountainous area where half
the land has already been converted to small- and
medium-sized farms. Approximately 90 percent of
the population owns land that is farmed, indicating
a heavy reliance on subsistence agriculture. Farm
sizes range from 1 to 50 hectares with an average
of eight hectares per family. The most rapid route
to economic progress for the vast majority of Intag
residents would be to raise real incomes by raising
existing farm incomes.
![]()
A study completed in 2006 estimated the value of various production alternatives on a hectare of land (specifically in the Rio Cristopamba Valley). The study provided an interesting analysis of typical farms. Values obtained were based on the assumption that the crops listed below are primary, with additional products (such as those mentioned in the preceding paragraph) being mixed in and being used by the family.
Values (per year) are as follows:
Beans and corn (depends on the varieties used):
$350 per ha - $970 per ha
Cabuya: $900 per ha
Tree tomato: $1,160 per ha
Sugar cane: $1,920 per ha
Coffee: $4,930 per ha
Mixed fruits (primarily citrus): $9,570 per ha The value of livestock use of the land was also
evaluated. Values ranged from $133 per ha for beef
cattle, $230 per ha for milk production, and $585 per
ha for female pigs.43
Other estimates for sugar cane (obtained through personal communications) range from $1,500 per hectare per year to $3,500 per hectare per year for cane that is transformed into panela, or alcohol. Miel de panela is also used and sold.
Livestock is an essential part of the local economy. Pigs, chickens, cows, and some guinea pigs are used
by families and/or sold in markets. Approximately 50 percent of the cattle are used regionally for milk and meat for families. The other 50 percent are sold in domestic markets. The heads of cattle that are sold, are sold in local markets for $300 to $400 a head, with an estimated two to three cows sold per year. Many families sell their surplus milk to a local milk cooperative (CORPIL) that processes the milk before it is transported to Quito. Approximately 2,500 liters of milk are gathered by three small trucks each day. Each farm supplies between 5 and 150 liters per day and is paid $0.24 per liter (depending on the milk price at the time). In one day, $600 worth of milk is picked up, translating to $3,000 in one week alone.

Milk from the Intag zone is considered to be of higher quality due to the environmental conditions as well as the specific animal genetics.
Coffee Production
Coffee is an important global commodity; it is, in fact,

the second most traded outside of oil. In Ecuador,
a total of 150,000 families survive on income from
coffee production. It is a $60 million per year
economic enterprise and contributes significantly to
the GDP.

AACRI (Asociaci6n Agroartesanal de Caficultores Rio Intag) was started in 1998 with 18 participants. Currently, 400 families are part of the coffee co-op,
cultivating the arabic shade-grown coffee organically. By establishing a co-op, decisions can be made locally and higher prices can be obtained for the coffee. Co- op members are paid $170 per hundred pounds for high-quality coffee and $150 per hundred pounds for lower quality coffee. In 2010, approximately 180,000 were processed and roasted in Intag to be sold in markets in the region as well as Otavalo and Quito. Another 40,000 pounds were exported.
Crafts
Mujer y Medio Ambiente has existed for 17 years in
the Santa Rosa and Plaza Gutierrez area. Currently,

43 women are part of the group and sell products handmade from locally harvested cabuya (sisal). Women reinvest in the group, decisions are made collectively, and 5 percent of each sale goes back into the group. Gross sales for 2006 were $22,661 with
a total net of $19,271 (after subtracting 15 percent for materials). Thus, each woman earned on average
$448 a year (depending on the number of items individually produced), with some women earning as much as $1,500.
Coordinadora de Mujeres de Intag has been in existence since 2002. Approximately 150 women from the entire region are part of the group, which focuses on gender inequality, domestic violence, participates in the Asamblea Cantonal (County Assembly), and develops alternative sustainable economic enterprises for the region. The group sells natural soaps, hats, bags, wallets, belts, and more-all handmade using locally grown cabuya. The products are locally sold in Intag, at a fair trade store in Otavalo and nationally.
Ecotourism
As described earlier, ecotourism is an enterprise that
is currently underway in Intag and has the potential
for far greater growth and development value. Some
of the activities visitors partake in throughout the
region include hot baths, birding, rafting, biking,
hiking, and generally enjoying natural areas and the
local culture. In addition, Intag is increasingly an
education center for international students on study
abroad programs, which brings foreign exchange into
the country. The following table indicates the number
of attractions in the region:
Table 4: Current Tourist Attractions
Community | Number of natural attractions | Number of cultural attractions |
Apuela | 8 | 3 |
Cuellaje | 6 | 4 |
Garcia Moreno | 13 | 5 |
Peñaherrera | 9 | 6 |
Plaza Guitierrez | 5 | 3 |
Vacas Galindo | 3 | 1 |
Total | 44 | 22 |
The thermal pools and cabanas at Nangulvi are some of the most popular attractions in the region.
Nangulvi has three cabanas with a capacity of 18 people and 5 pools. In 2005, from April to December, 776 people stayed overnight at Nangulvi while in 2006, from January to December, 1,169 people stayed overnight. Approximately, 69 percent of the visitors are Ecuadorian and 31 percent are foreigners. For the pools, 8,968 children and 14,173 adults were users
in 2005. In 2006, 7,318 children used the pools, and 12,847 adults.44
The ecotourism complex in Junin (3,000 hectares) can receive 24 people in cabanas and has a small restaurant. From August 2003 to January 2007, 486 guests registered, with an average stay of 2.8 days.
Visitor numbers have increased on average 34 percent every year.44
Some of the reserves offer accommodations. Reserva Los Cedros (6,000 hectares) estimated a total of 300 visitors in 2005 and 700 in 2006-most visitors were on study/research trips.44 Reserva La Florida (500 hectares) also hosts groups of people and estimates an annual visitation rate of 150 visitors. Other reserves include Siempre Verde (500 hectares) and Alto Choco (3,000 hectares).
Gualiman is a cultural site housing four burial mounds
and 66 smaller ones. A small museum is located on the site and accommodations for small groups are available. It is unknown how many guests visit the site per year.
Hydropower
El Consorcio Toisan, an umbrella organization
composed of several grassroots organizations, started
in 2006 with the objective of supporting sustainable
productive activities in the Intag region. Currently,
the consortium is developing a proposal, HidroIntag,
to generate 10 micro-hydro dams in the Intag region.
These dams could generate electrical power valued at
$30 million per year and would allow the Intag region
to be 100 percent energy self-sufficient, with excess
power being sold back to the grid. This project has the
potential not only to inject money into cash starved
public programs but also to provide indirect payments
for local ecosystem services. For this hydro project to
have long-term success, it will be crucial to maintain
the security of the watershed, to ensure a strong and
consistent flow in the rivers. To achieve this end, the
surrounding forest must be conserved.
Scientific Research
The Tropical Andes is considered the richest biological
hotspot in the world with approximately 15-17
percent of the Earth's plant species and nearly 20
percent of its bird diversity (more than 1,700).45 A
four-square-mile area of rainforest may contain as
many as 1,500 different types of flowering plants
and 750 species of trees, all of which have evolved
specialized survival mechanisms over the millennia
that mankind is just starting to learn about.46
Commercial interest in biodiversity is becoming more common, not only in the pharmacology and personal care product field, but also in the emerging field of biomimicry. Daily, plant, animal, and insect species are becoming extinct due to rainforest deforestation. As the species disappear, so do many possible cures for life-threatening diseases and today's most difficult problems.
In 1983, there were no U.S. pharmaceutical
manufacturers involved in research programs to
discover new drugs or cures from plants. Today, over
100 pharmaceutical companies and several branches
of the U.S. government, including the National Cancer
Institute, are engaged in plant research projects
for possible drugs and cures for viruses, infections,
cancer, and AIDS. Merck & Co. made a $1 million
dollar deal with Coast Rica's National Institute of
Biodiversity to screen plants, insects, and micro-
organisms for medicinal compounds. G.D. Searle &
Co. and Pfizer have similar arrangements with U.S.
botanical gardens.47
![]()
According to the U.S. National Cancer Institute, more than two-thirds of all medicines found to have cancer- fighting properties come from rainforest plants.48 Ingredients synthesized from a now-extinct periwinkle plant once found only in Madagascar have increased the chances of survival for children with leukemia from 20 to 80 percent.48
Many companies are turning to rainforests for help
innovating personal care products ranging from soaps
to perfumes. The agave plant is now valued for hair
care products. New fragrances and scents are being
developed from orchid species.
Biomimicry is the science and art of emulating
nature's biological ideas to solve human problems.
For example, carbon-sequestering cement mimics
corals and energy-efficient wind turbines mimic
schooling fish. The rainforest offers scientists and
engineers countless opportunities to explore and
innovate. Business entrepreneurs are rapidly turning
to nature to solve sustainability and health problems.
The use of indigenous resources such as plants,
animals, and knowledge should be done with respect
and informed consent of indigenous people.
Another example of biomimicry is a self-cleaning fabric innovation developed after studying butterflies. Engineers observed that nano-scale surface structures on butterfly wings repel water and most dirt and
also cause dirt particles to be carried away by water. Schoeller Technologies AG of Switzerland is now marketing NanoSphere®, a fabric treatment that is self-cleaning, dirt- and water-repellent, and abrasion- resistant. Less washing and abrasion reduce use of natural resources and harmful chemical cleaners.49
Choosing Between Development Alternatives
Ecosystems are increasingly more valuable. Just as
the value of metals increase as they become scarcer,
so do ecosystems and their services and products.
In the face of climate change and the declining
number of intact healthy ecosystems, the remaining
ecosystems, such as Intag, will increasingly be more
valuable.
Cost/Benefit Analysis
A cost/benefit analysis is an economic decision-
making process that adds up the benefits of a public
policy and compares those benefits to the costs.50
But how do we assess value for something that is
priceless, such as breathable air? Consider the value
of one ecosystem service, photosynthesis, and the
ecosystem benefit it produces, atmospheric oxygen.
This indicates that the value of photosynthesis and
atmospheric oxygen to people exceeds the value of
the gross world product-and oxygen production
is only a single ecosystem service and good. Having
breathable air means we stay alive.
Frank Ackerman and Lisa Heinzerling's book, Priceless:
On Knowing the Price of Everything and the Value of Nothing, reviews the economic method of cost/ benefit analysis. They argue that things that are priceless, such as human life, are given a monetary
value to determine whether endangering activities are prudent and/or have the right to occur. Unfortunately,
the costs and benefits of an action (or inaction) are often calculated using methodologies which can
be manipulated to justify decisions based on the analyst's preference.
An example of this can be found in the United States' Office of Management and Budget's 2002 estimate that the value of protecting 60 million acres of forest land was a mere $219,000 per year. However, by
only calculating the cost saved from not building or maintaining roads in the area, environmental
benefits of the forest ecosystem and the value they provide to the local, national, and global economy in the form of ecosystem services were completely ignored. In terms of cost, the study asserted that
preserving the land prevented society from realizing
$184 million in economic activity the forest could
provide if developed.51 This study also disregarded the
future values society might derive from the forest's
existence, such as clean water, recreation, flood
protection, and local climate stability. Given such
manipulated estimates, government protection of
the land was argued ineffective from a cost/benefit
standpoint and regulations that were created to
ensure long-term sustainability were discounted and
debated as inefficient protectionism by free-market
advocates.
Consider applying historical injustices in the current-
day free market: In the absence of regulation and laws restricting certain activities, we would allow slavery, child labor, and toxic pollution. Seemingly, "anything profitable that is not prohibited by law is likely to occur" in a free market scenario.51
What is the Value of Life?
A literature review concluded that $5 million-6
million is a range for the value of a human life (1999
dollar values) used by the US Federal Government.51
Using a Quality Adjusted Life Years (QALY) model
common to health economics, this value is
discounted for the poor, disabled, and elderly. This
methodology raises a key question: Do disabled or
elderly people value their lives less than healthier or
younger people? This approach to valuing life would
be morally reprehensible to many, yet this kind of
justification is precisely what is used in cost/benefit
calculations that include social impacts and human
health.
The Intergovernmental Panel on Climate Change (IPCC) released an infamous life-evaluation report in 1995 that provided values for economists to use
when calculating individual lives affected by climate change. To arrive at these values, the report used the economic value produced by the countries in
which people lived as the determining factor. Thus, a person's life in a rich country was worth $1.5 million,
Figure 2: Illustration of the difference between price and value.

Source: Nina Paley, Mimi and Eunice
while a person's life in a poor country was $100,000. Due to the outrage that ensued when this report was released, IPCC revised its figures to $1 million per person, regardless of where they lived in 2001.51 Although the IPCC's figures were revised, this case is illustrative of the methods economists often employ
to assign value to things (in this case people) that are priceless.
Ecological Economic Analysis
It is commonly accepted that natural resource
depletion is on an unsustainable trajectory. Around
the globe there are critical shortages of natural
resources, yet the destruction of ecosystems
continues, impacting biodiversity and amplifying
the effects of climate change.52 Despite decades of
widespread scientific documentation and concern
about natural resource depletion, the trends continue
to worsen.53 Why are we unable to respond to this
critical information?
One major reason is that our dominant economic
systems value and promote unlimited growth in a
finite world, and are blind to critical boundaries and
shortages of nature's goods and services (natural
capital). Current economic doctrine places natural
systems as a subset of the economy. That subset is
valued only as a source of raw materials for man-
made goods and services and is used as an infinite
sink for pollution and used products.
Common sense tells us that the whole economy is absolutely dependent on nature's goods and services (imagine life without fresh water, oxygen, and topsoil), yet often no economic value (beyond extractive value) is placed on nature under common economic analysis. Consequently, conventional economic decision- making is blind to costs occurring when natural systems are damaged, and cannot justify spending money to protect, improve, or repair natural capital until after ecological collapse generates economic catastrophe.
Fortunately, there has been progress. The recent United Nations TEEB report (The Economics of
Ecosystems and Biodiversity) highlighted the value of natural assets, and the World Bank has announced a partnership to develop methods and guidelines for integrating the value that ecosystems provide with national accounts.54 55
Ecological economics is generating new measures and analyses to address the increasing scarcity of natural capital and rising population demands. Appendix A provides background on ecological economics to help elucidate the increasing importance and applications of science-based economic analysis to human well- being, sustainability, and economic progress. The ecological economic framework looks at ecological structure and processes that make up the functions of an ecosystem, and illuminates the role that they play in local, regional, national, and global economies.
Applying the Best Science and Economics
Methodologies for valuing ecosystems services
have advanced rapidly. Section 4 of this report can
be used to bolster traditional cost/benefit analysis
or to inform a multi-criteria analysis for projects
and polices in the Intag region. Many countries
and regional governments are exploring ways to
incorporate the value of ecosystem services into land
use and planning decisions. In 2010, the Peruvian
congress passed a law requiring environmental
impact statements (EIS) for all development projects
to include ecosystem service valuation. This bold step
helps ensure the sustainable growth of the Peruvian
economy in a world of diminishing natural resources.
Indeed, those countries that balance investments in
built, natural, human, and social capital will be in the
best position to have thriving economies and healthy
populations in the 21,. century.
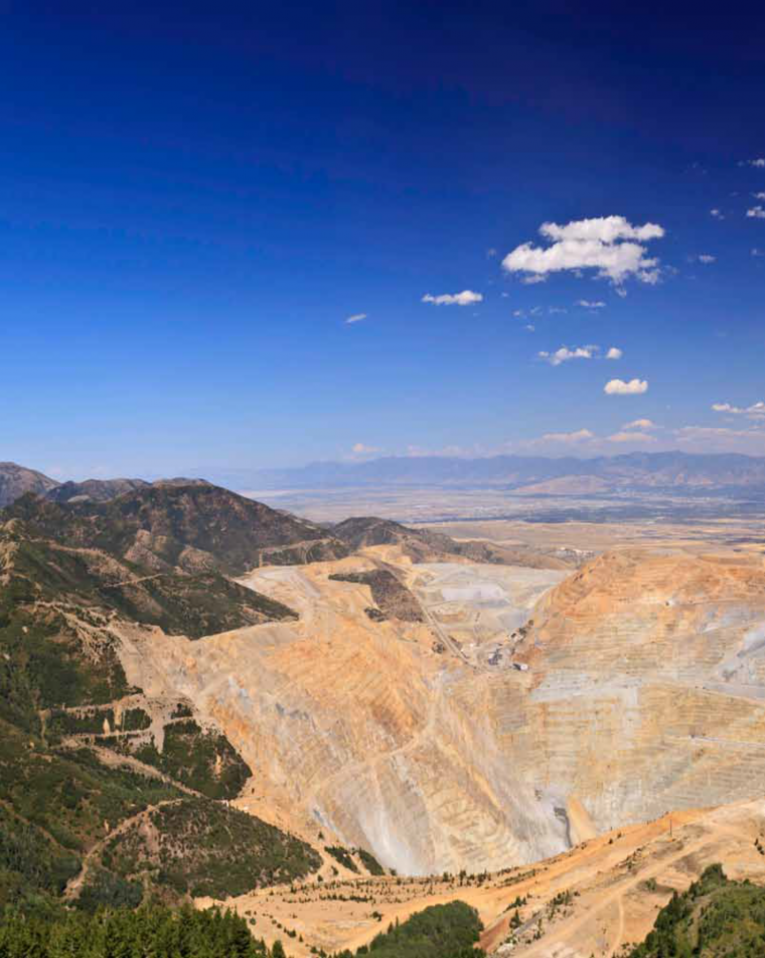
$@*;<'6 &0 *" &<6" <), %&<<61 ;)"6A B)"(9*; C*"/&" D6""6%&,,
%&<<61 ;)"6 )" E,*9 )3 &"6 &0 ,96 '*1(63, &<6" <), ;)"63 )" ,96 >&1'.
*". %*" F6 366" 01&; &1F),A

=*1, 44
Copper Extraction and Revenue

![]()
Section Summary: According to the exploration carried out by Bishi Metals in the 1990s, there could be as much as 318 million metric tons of copper ore in the area of Junin, equivalent to 2.26 million tons of pure copper. The uncertain aspect of the deposit is due to the fact that not enough exploration was carried out to confirm the deposit. This section describes copper markets, production and pricing and explores projected costs and income from copper mining in lntag. A discussion of regulatory framework and remediation is provided with case study examples.
9%66/&
"Copper is one of the metals that has been in
use longest. It has been an important material
in the development of civilization because of its
high ductility, malleability, thermal and electrical
conductivity, and resistance to corrosion. Copper has
become a major industrial metal, ranking third in
quantity after steel and aluminum."56
Common uses of copper include building construction (wire, cable, plumbing and gas tubing, roofing, and climate control systems), aircraft parts (undercarriage components, display unit components, and helicopter motor spindles), automotive parts (wire, starter motor, bearings, gears, and valve guides), industrial applications and machinery (tools, gears, bearings, and turbine blades), furniture, coins, crafts, clothing, jewelry, artwork, musical instruments, cookware, and more.
Once extracted, copper goes through industrial processes before being utilized in consumer products. Copper is contained in ores that must be extracted mechanically, most often in an open pit. This capital- intensive process implies the removal of huge volumes of soil that have to be crushed and concentrated. To extract the copper from the ore, an energy intensive
process is needed. Copper smelting is mostly done with pyrometallurgical techniques that can produce significant air emissions of sulphur oxides, arsenic, or other pollutants.
World Copper Production
Among copper producers, Chile has a dominant
market position, at approximately one-third of world
copper mine production. The next largest producers,
the United States and Peru, trail substantially, at
nine percent and eight percent respectively.57 It is
worth noting that according to a Japanese study in
1998, there is an estimated possible reserve of 318
million metric tons of copper ore in Intag at a .71
percent copper grade, equivalent to 2.26 million tons
of the pure metal.ii 9 In 2010, the world consumed
approximately 19 million tons of copper.58 A typical
deposit of this size could take anywhere from 10 to
20 years to fully exploit depending on the rate of
extraction and processing of the ore.
![]()
-- The Japanese company, Bishi Metals (now Mitsubishi Materials Corporation) discovered copper deposits in the Intag region in the 1990s. A team, organized by the Japan International Cooperation Agency (JICA) and the Metal Mining Agency of Japan, completed the environmental impact statement in 1996, with an updated version released in 1998.
Figure 3: Worldwide Copper Production in 2008 (metric tons) :;
Chile (5,330,300)
United States (1,310,000)
![]()
![]()
Summary of Internal Costs |
Opening of the mine |
Extraction |
Transport |
Treatment |
Copper production costs, net of by-product credits per lb of copper |
Off-property costs for transport, treatment (smelting and refining), and sales per lb of copper |
Total cash costs of production per lb of copper |
Australia (886,000)
35%
9%
6%
6%
8%
36%
China (960,000)

![]()
Peru (1,267,867)
All Others (5,605,112)
Summary of Externalized Costs |
Surface water pollution |
Volatile waste creation |
Costs of using police and public security forces |
Potential groundwater contamination |
Impact on fish, shellfish, and agricultural production |
High cost of remediation |
Adverse relationship to genuine progress |
Dependency on mineral prices |
Widespread deforestation |
Energy Needs |
Copper Extraction
Open pit copper mining is an extremely capital and
time intensive investment. Describing the detail and
complexity of the copper industry is beyond the
scope of this report, but the basic phases of mining
are as follows: (1) Prospecting; (2) Exploration; (3)
Exploitation; and (4) Reclamation. Figure 4 provides a
detailed snapshot of the copper mining process.

Note that there are only 124 copper smelters in the world, ten of which are in South America, and none in Ecuador.59 Returns on copper mining investments are significantly lower when off-property costs are calculated.
Figure 4. Copper Processing 60
Gyratory Crusher
Coarse Ore
Secondary Cone Crusher
H(O
Tertiary Cone Crusher
Thickeners
Screens
Cyclones
Stacker Heap Leach Piles
Oxide Sulphide
Advance Electolyte
Tailing Pond
Flotation
Concentrate
Pregnant
Solution
Pond
Solvent Extraction
Electrowinning Cells
Concentrate
Copper Cathode
Copper Production Costs
Copper production costs vary in each mine location.
For example, operating statistics from the Gibraltar
copper mine in British Columbia, Canada, for the years
2010 and 2008 show that the cost of production and
off-property costs (transport, treatment, and sales)
came out to be $1.78 per pound of copper in 2010
and $2.30 per pound of copper in 2008.61 These cash
costs of production figures are a non-GAAP measure
that do not take externalities into account.---
Copper Price Volatility
Copper prices are renowned for boom and bust cycles
dependent on global economic growth, which drives
demand, and global production output, which drives
supply. When prices are high, many proposed mines
are developed independently with the expectation
of high prices. Yet as new mines come online the
increased supply drives prices down, sometimes
precipitously, and some new mines quickly go
bankrupt. This partially accounts for the frequent and
often severe dips in copper prices since 2001.
The London Metal Exchange (LME) is the world's premier market for non-ferrous metals. It offers a range of futures and options contracts, which allow traders to try to secure costs for materials months and years in advance. "The prices 'discovered' at the LME are recognized and relied upon by industries throughout the world."62 Figure 5 shows real copper prices since 1870. Figure 6 shows global prices of copper since 1995. Starting in 1999, the price of
copper increased significantly due, in large part, to the increased demand in Asia.
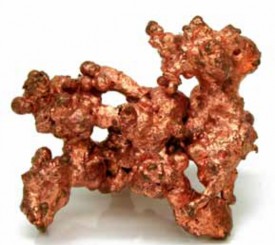
Native Copper
![]()
---
GAAP is defined as Generally Accepted Accounting Principles.
Figure 5: Real Prices for Copper, 1870-1997 63
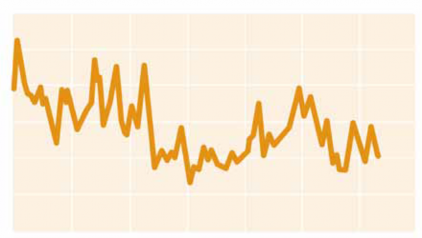
3.0
2.5
US$ per pound
2.0
1.5
1.0
0.5
1890
1910
0.0
1870
1930
1950 1970 1990
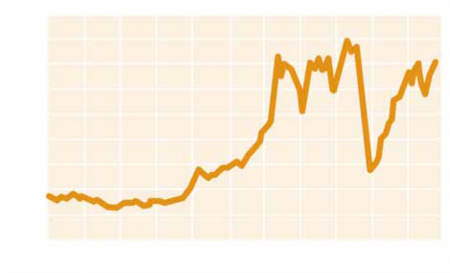
Figure 6: Copper Prices since 1995 87
4.5
4.0
3.5
US$ per pound
3.0
2.5
2.0
1.5
1.0
0.5
0.0
1996 1998 2000 2002 2004 2006

Selling Copper
The best way to explain what it takes to produce
copper is to look to those who do it. QuadraFNX is
a Canadian mining company involved in producing
copper around the world. They explain how the
copper they produce in the Robinson open-pit mine in
the U.S. state of Nevada is sold.

Running a successful mine requires significant working capital. Figure 7 illustrates the time period between mine concentrate production and final settlement payments.
Copper is sold by mining companies in two ways, concentrate sales (impure copper powder) and cathode metal sales (pure copper) depending on the type of ore deposit processed. Concentrate producers sell a concentrate powder containing 24-40 percent copper metal content to a smelter and refiner. The concentrate is sold using a formula that is unique to each smelter but general terms are as follows:
The smelter pays the producer about 96 percent of the metal value based on metal content contained in the concentrate and based on a future average price know as the quotational price less the treatment charges ("Tcs") and refining charges ("Rcs"). Historically the smelters and refiners have participated in price upside via an arrangement known as "price participation" in which the smelters and refiners share in 10 percent of the value of the copper above a certain threshold, historically approximately 90 cents per pound of payable copper metal. Currently, price participation terms are not included in most smelter sales contracts. Tcs are charged on a $ per tonne of concentrate treated and Rcs on a $ per pound of metal refined. The charges fluctuate with the market but are often fixed on an annual basis. By-product metals such as gold and silver have separate refining charges. ln addition, the smelters and refiners require concentrate specifications that limit the amount of impurities allowable in the concentrate (an example would be the amount of allowable arsenic) and these limits vary from smelter to smelter. lf the concentrate producer does not meet these specifications financial penalties are levied. Normally third party assayers take samples of the concentrate during the shipping of concentrate to a smelter and determine the level of payable metal, moisture and impurities in the concentrate. lf there are disagreements between the concentrate producer and the smelter as to the assay results they are usually settled by a third party umpire.
The Robinson Mine produces a copper concentrate that contains approximately 25 percent copper, as well as gold. The concentrate is shipped to smelters in Asia where the material is processed to recover the nearly pure metallic copper and gold.
Figure 7: The Timing of the Quotation Pricing Between the Concentrate Producer and the Smelter and Refiner. 64

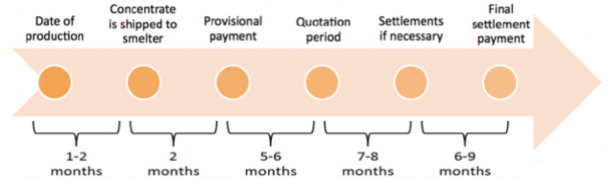
Quadra transports the concentrate material (via truck and train) to the port in Vancouver, Washington
where it is loaded onto ships that deliver the product to smelters in Asia. The customer takes legal title to the
concentrate when it is loaded on a ship, and Quadra recognizes revenue at this time. However, it takes several
months from this point before final saleable copper can be produced by the smelter and final settlement of
the price is made.
Smelters generally act as a 'toll' business and do not want to risk their profit margin on a changing copper price. As a result, the concentrate market has evolved so that the concentrate producers (the mines) assume this price risk. ln Quadra's case, the final price of the copper concentrates is not determined until approximately 3-4 months after the product has been delivered to the customer at the port.
For accounting purposes, the revenue is recognized at the time of delivery based on the LME quoted copper prices at that time (the "provisional price"). At each quarter-end, this provisionally priced copper is revalued based on the quarter-end forward copper price for the expected date of final settlement and this accounting revaluation creates "provisional price adjustments".
ln terms of cashflow, Quadra receives an initial payment at the time the product is loaded onto a ship at the port. This initial "provisional payment" is calculated based on 90 percent of the estimated contained metal
in the concentrate, using the LME quoted copper price at the time of delivery. After the final pricing has been established (3-4 months after initial delivery) a final invoice is issued and the initial provisional payment is adjusted for the final copper price. ln the case of a significant price decline, Quadra would have to refund the customer a portion of the initial provisional payment. 64
The following table shows cash flows and revenues from the sale of copper on a shipment in September 2008 from the Port of Vancouver, Canada to a port in China.
Table 5: Cash Flows and Revenues from the Sale of Copper on a Shipment 64
Date | Activity | Revenues | Cash flow |
Sept. 2008 | Concentrate material is produced at Robinson and shipped by truck/rail to the Port of Vancouver, Washington. | - | - |
Oct. 22, 2008 | Ship leaves Port of Vancouver, Washington, with 10,000 dry tons of copper concentrate (containing 26.8% copper, assuming no gold by-product). Customer takes legal title and makes initial payment based on current copper price of $2.40/lb. | + $12.4 M | + $11.1 M |
Nov. 15, 2008 | Ship arrives at customer's port in China. | - | - |
Dec. 31, 2008 | Receivables are revalued for accounting purposes based on quarter-end copper price of $1.32/lb. | - $5.6 M | - |
March 2009 | Final invoice is prepared based on average metal copper price during Feb. 2009 (3 months after month of arrival) of $1.50/lb copper among with final weights and assays. Final invoice was calculated at $12 million. | + $0.9 M | - $3.4 M |
TOTALS = | $7.7M | $7.7M |
Economic Estimates of Junin's Mineral Deposit
The royalties will be based as a percentage of
sales of primary and secondary materials and will
be paid twice a year. Article 93 of the Ecuadorian
Mining Law states that mining concessionaries will
have to pay royalties of no less than five percent of
sales revenue. In addition to this payment, mining
concessionaries are subject to four national taxes:
25 percent for income tax, 12 percent tax on profits,
12 percent for value added tax, and 70 percent tax
for windfall gains.65 However, at the time of writing,
the government has not yet made clear the taxation
formula it will use, and it could make considerable
changes to the taxation regime described above.
Without a written contract between the mining company and the Ecuadorian government, final profit calculations generated from the copper mine in Intag are not possible. The National Mining Plan of Ecuador estimates that the Junin mine in Intag could generate
$85 billion. However, the mining plan provides no specifics of how this estimate was calculated.
Resources estimate the mineral concentration in the ground. Reserves tell us how much ore may be economically and legally recoverable. How much ore is ultimately recovered as mining takes place is dependent upon the actual geology, slope
stability, hydrology, weather, quality of engineering, overburden ratio, global economic growth, metal prices, content of associated minerals, the regulatory regime, level of corruption in both private and public institutions, social acceptability in the community, remediation, accident frequency and size, and other aspects.
In the past, over-reporting of mineral reserve estimates was a problem in the mining sector during the exploration phase of some mines. For example,
the Bre-X Minerals Ltd. scandal, fraudulently over- estimated gold reserves in Indonesia and became one of Canada's greatest stock collapses. As a result, Canada and other countries instituted new rules such as NI 43-101 relating to mineral resources
and reporting thereof that standardized and legally codified the process.
National Instrument 43-101 (or NI 43-101) is a
Canadian codified set of rules and guidelines for
reporting information related to mineral properties.
It requires that companies traded on the Canadian
stock exchange provide technical report information
from an independent source on mineral resources. A
NI 43-101 compliant inferred resource was verified in
2003 by Micon International of 1.36 billion tonnes at
.73 percent Cu, 0.03 percent Mo, 1.6g/t Ag and .01g/t
Au or 0.98 percent copper equivalent at 0.2 percent
copper cut-off.iv
Mineral resources and reserves are different. The US Geological Survey defines mineral resources as "a concentration of naturally occurring solid, liquid, or gaseous materials in or on the Earth's crust in such form that economic extraction of a
commodity is regarded as feasible, either currently or at some future time." Also resource estimates calculate both concentration and tonnes (quality and quantity). Mineral reserves are defined as "that
portion of an identified resource from which a usable mineral commodity can be economically and legally extracted."
There are three definitions based on different levels of uncertainty given to potential economically viable identified mineral resources: inferred, indicated and measured.
Inferred: Materials in identified but unexplored deposits whose quality and quantity have been
![]()
See Appendix E for additional information of the inferred resources presented by Micon International and the concerns of validity.
estimated from geologic projections.
Indicated: Materials whose quality and quantity have been estimated partly from analyses and measurements and partly from reasonable geologic inferences.
Measured: Materials whose quality and quantity have been determined, within a margin of error of less than 20 percent, by quantitative data, including appropriate analyses, from closely spaced and geologically well- known sample sites.
The concession now belongs to Enami EP (the Ecuadorian state mining company). In 2009, Enami EP signed a four-year agreement with CODELCO, a Chilean mining company, which allows CODELCO to explore mining concessions in Ecuador.67
Table 6: Junin Preliminary Revenue Estimates
Summary Scoping Level Economic Estimate (+/- 30%) | |
Estimated CAPEX | $1,573,552,691.83 |
Estimated OPEX | $6.96 USD per tonne of ore |
Pre Tax NPV @ 8% Discount rate | $21,735,218,408.39 |
Assuming 5% Royalties | $1,086,760,920.42 |
Assuming 30% Net Tax | $6,520,565,522.52 |
Economic Estimate for Ecuadorian Government | $7,607,326,442.94 |
CAPEX: Capital Expenditures OPEX: Operational Expenditures NPV: Net Present Value
Open-Pit Mine Remediation and Compliance
In Intag, an open-pit copper mine is proposed. To
mine the ore, it will be necessary to excavate, and
relocate large quantities of topsoil, waste rock, and
ore. For every ton of rock and soil, a typical copper
mine produces 3-4 pounds of copper, five ounces
of zinc, three ounces of lead, and two ounces of
arsenic.30 In addition, the overburden, or rock, sand
and soil, expands in volume significantly, thus there is
a far larger volume of material to dispose of than mine
pit space. This changes the topography and flow of
both surface and ground water (virtually all open pit
mines extend into groundwater resources). Since the
main objective in any commercial mining operation
is to maximize profits by the removal of the mineral
deposit at the lowest possible cost, the selection of
physical design parameters and the scheduling of the
ore and waste extraction require complex geologic
engineering, as well as logistical, environmental, and
economic planning.
In Ecuador, mining concessionaries have to pay an annual reclamation fee to conserve their mining concessions. For the initial exploration phase, the annual fee is set at 2.5 percent of the legal monthly minimum wage per hectare (equivalent to $6.50 as of this writing). The fee doubles for the advanced exploration phase, and doubles again for the exploitation phase.68
Site restoration, also known as reclamation, is critical to alleviate or mitigate potential long-term impacts of mining, including those described in Part 1 of
this report: surface and ground water pollution; management of toxic runoff and waste, including acid mine drainage; impact on fish and shellfish; and, most importantly, avoidance of ecological disaster.
Remediation costs vary dramatically. They are far lower in an arid desert such as the Atacama of Chile, than in steeply sloped, high rainfall tropical cloud forests. If there is no provision in the mining law to
require the mining company to pay for the cleanup, there is the risk for the taxpayers to carry the burden of remediation costs.
The cost of environmental protection, for both producers and government, can be significantly decreased by proactively incorporating it into initial planning and design, rather than performing remedial measures to compensate for design deficiencies. When issues are addressed on an ad hoc basis as problems develop or enforcement actions occur,
costs rise sharply. There are numerous examples of the costs associated with environmental damage once a site is closed and, in many cases, the producer exhausts the remediation funds or even files for bankruptcy to avoid further costs to the parent company. When this happens, local governments
must shoulder the costs of dealing with the wasteland and local people suffer the health and environmental impacts. This becomes a liability for the national economy. In Peru, an estimated $77.5 million is needed to deal with mining's environmental legacies and remediation costs from the preliminary list of the most critical sites. Many specialists and government officials have even said this figure is unrealistically low.69
Table 7: Examples of Remediation Costs
Location | Primary Mine Type | Clean-up Costs |
Papua New Guinea | Open-pit copper | Settlement agreement of approximately $350 million dollars for the OK TEDI mine.70 |
Montana | Open-pit copper | Estimated $400 to $500 million for one mine site.71 |
Utah | Open-pit copper | Paid the state $9 million to replace sources of contaminated water in the primary aquifer. State costs were $28 million for building a water treatment plant (operational costs not included).71 |
Arizona | Open-pit copper | Potential unfunded environmental liability between $73 and $292 million.72 |
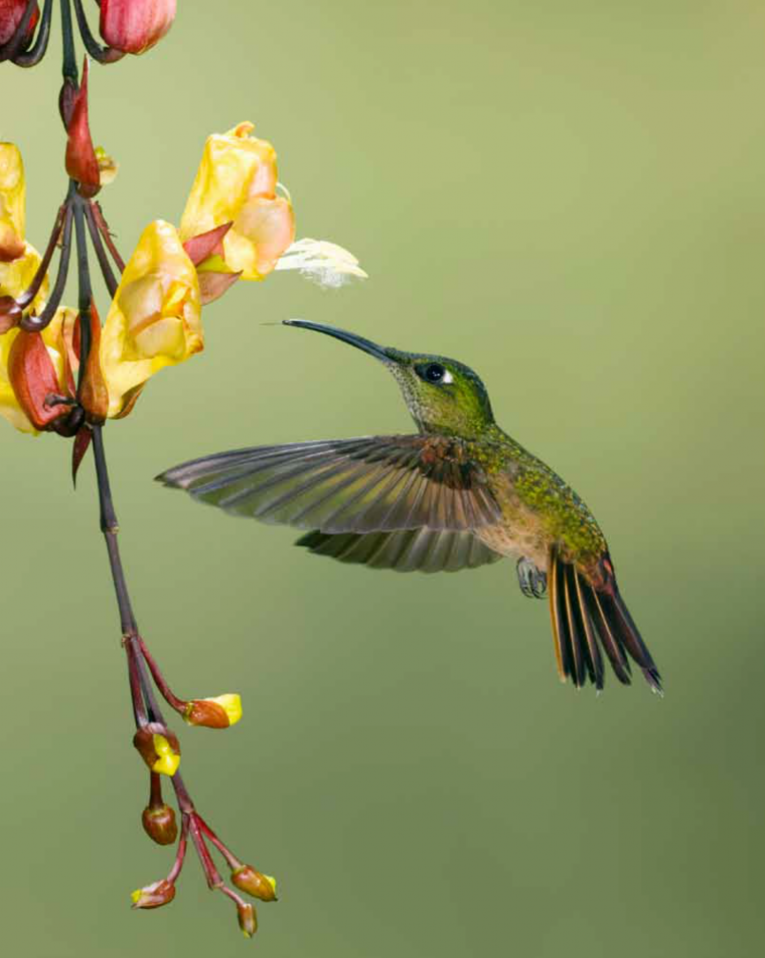
36
B-00G,*)'6. C&1&"6, HBoissonneaua flavescensI
)3 * 3<6%)63 &0 9-;;)"(F)1. 0&-". )" 4",*(23
%'&-. 0&163,3A

=*1, 444
Ecosystem Services in Intag

Section Summary: Ecosystem services can be divided into four categories: Regulating, Habitat, Provisioning, and lnformation Services. This section reviews local perspectives on ecosystem services and provides specific examples of ecosystem services in lntag.
Categories of Ecosystem Services
The Millennium Ecosystem Assessment classifies
ecosystem services into four broad categories, which
describe their ecological role. Under this framework,
both goods and services are referred to as "Ecosystem
Services."
![]()
![]()
![]()

Local Perspectives
In May 2010, a skillshare workshop in Nangulvi
(located near the Intag River) was held to discuss
the trends of ecosystem services with the local
stakeholders and to gather local knowledge and
perspectives of ecosystem services in Intag. In order
to gain further knowledge and a new perspective of
the direct status of the benefits provided by natural
systems, local people identified valuable ecosystem
services and rated their condition. A basic numeric
ranking system was used to prioritize ecosystem
service importance-water supply was ranked the
highest.
Ecosystem Service Descriptions and Examples
Working with the local community of Intag between
2008 and 2010, we identified 23 ecosystem services
that contribute significantly to the economy, culture,
and quality of life for regional residents.
Specific ecosystem services exist within each category. These services are identified in Table 8.
Table 8: List of 23 Ecosystem Services73
Good/Service | Examples | |
Pr o visioning | Water Supply | Provision of water for consumptive use, includes both quality and quantity |
Food | Hunting, gathering of fish, game, fruits, etc.; small-scale subsistence farming and aquaculture | |
Raw Materials | Building and manufacturing; fuel and energy; fodder and fertilizer | |
Genetic Resources | Improve crop resistance to pathogens and pests | |
Medicinal Resources | Drugs, pharmaceuticals, chemical models, tools, test and essay organisms | |
Ornamental Resources | Resources for fashion, handicraft, jewelry, pets, worship, decoration and souvenirs | |
Re g u l a t i n g | Gas Regulation | Provides clean, breathable air; disease prevention; and a habitable planet |
Climate Regulation | Maintenance of a favorable climate promotes human health, crop productivity, recreation and other services | |
Disturbance Prevention | Prevents and mitigates natural hazards and natural events, generally associated with storms and other severe weather | |
Soil Retention | Maintains arable land, prevents damage from erosion and promotes agricultural productivity | |
Water Regulation | Provides natural irrigation, drainage, channel flow regulation and navigable transportation | |
Biological Control | Provides pest and disease control, reduces crop damage | |
Waste Treatment | Pollution control/ detoxification; filtering of dust particles through canopy services | |
Soil Formation | Promotes agricultural productivity and the integrity of natural ecosystems | |
Pollination | Pollination of wild plant species and harvested crops | |
Nutrient Regulation | Promotes health and productive soils, and gas, climate and water regulations | |
Habit a t | Habitat and Biodiversity | Maintenance of biological and genetic diversity (and thus the basis for most other functions) |
Nursery | Maintenance of commercially harvested species | |
ln f orma tion | Aesthetic Information | Enjoyment of scenery |
Recreation | Travel to natural ecosystems for eco-tourism, outdoor sports, etc. | |
Science and education | Use of natural systems for school excursions, etc. Use of nature for scientific research | |
Spiritual and historic informatio | n Use of nature for religious or historic purposes (i.e., heritage value of natural ecosystems and features) | |
Cultural and Artistic Information | Use of nature as motive in books, film, painting, folklore, national symbols, architecture, advertising, etc | |

Gas and Climate Regulation
Gas and climate regulation refers to the roles that
ecosystems play in regulating the gaseous phase
of compounds, organic and inorganic, which affect
atmospheric composition, air quality, and climate
regulation. The oxygen that people breathe is a
product of photosynthesis from marine plankton and
terrestrial plants. Removal of pollutants is another
important aspect of gas and climate regulation.
Low air quality can cause health care costs to spike
as respiratory diseases develop. The regulation of
climate is dependent on the composition of the
atmosphere. Greenhouse gases, such as CO( /&" transparent to light but trap heat, warming our planet
like a greenhouse. Carbon dioxide is removed through carbon sequestration as plants absorb CO( to produce roots, shoots, stems, and leaves.

Maintaining a climate within a stable range is increasingly a priority for local, federal, and international jurisdictions. The role of forests and other ecosystems in controlling greenhouse gases (GHGs) that contribute to global warming is essential to maintaining a stable climate and prosperous economy. However, carbon sequestration is not the only value provided by gas and climate regulation. Agricultural soils can also sequester more carbon when certain techniques are used, including crop rotations, livestock waste disposal and conservation tillage, especially no-till.74 75 Because these types of practices could provide significant global value, there is increased interest in including agricultural lands
in carbon trading markets, with farmers receiving payments for their sequestration.
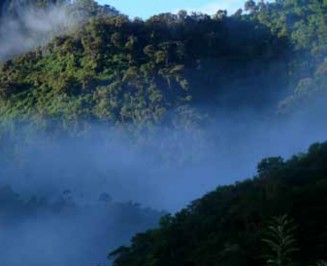

Carbon offsetting by means of reforestation has
become a major priority in Ecuadorian policy.
The Ecuadorian Ministry of Environment implemented
Programa Socio Bosque (meaning Forest Partner, in
English) in 2008 where landowners are paid up to $30
per hectare to maintain their native forests. Funding
provided by UN-REDD Programme.


PROFAFOR (Programa FACE de Forestaci6n) provides carbon dioxide emissions trading in Ecuador, which in 2005, traded at rates of up to $77 to $135 per hectare of land that is reforested.v Local programs have been implemented by schools in Intag to work with carbon offsetting organizations to help reduce CO( emissions created by air travel.76
![]()
Adjusted for inflation. Original rates from PROFAFOR were $68 to $119 per hectare.
Disturbance Prevention
One of the most significant factors in an ecosystem's
ability to prevent flooding is the absorption capacity
of the land. This is a factor of land cover type (forest
vs. pavement, for example), soil structure and quality,
as well as other hydrological and geological dynamics
within the watershed. The U.S. Geological Survey
estimates that urban development leads to increases
in peak flood discharge flows of 100-600 percent
for 2-year storm events, 20-300 percent for 10-year
events, and 10-250 percent for 100-year events.77

Retention of forest cover and restoration of floodplains and wetlands provide tangible and valuable ecosystem services. For example, upland forests absorb rainwater, which significantly reduces its downhill and peak flows into major stream and river systems. In undeveloped areas of a watershed, typically less than 15 percent of precipitation reaches streams or rivers as surface runoff, compared with

55-70 percent in a developed watershed. In Ecuador, record flooding occurred in 2008, which affected many communities downstream from the Andes over the
flat Ecuadorian Coast.78

One of the most critical ecosystem services is flood risk reduction. The loss of wetlands, forests, and natural systems that reduce peak flows and promote infiltration and conveyance also increase flood risk. No current flood planning in Ecuador fully accounts for the protection provided by both natural and built infrastructure.
Preventing flooding in Intag and the lower reaches of the Esmeraldas River will require understanding the ecosystem service function of water regulation. Flood risk mitigation is crucial to making good investments, both in natural and built capital.

The tropical vegetation of the mountain ranges in
Intag hold substantial amounts of water throughout
the entire year, especially during peak rainy months of
December to April.79 On average, the annual rainfall in
Intag ranges between 1,000 and 3,000 mm, and often
exceeds this range during exceptionally wet rainy

seasons, for example, an El Nino event. The vegetative
system in these mountains is vital to downstream
communities. Without the existence of the tropical
cloud forests of Intag, a substantial amount of the
rainfall would overflow the rivers and flood several
regions at the base of the river system.
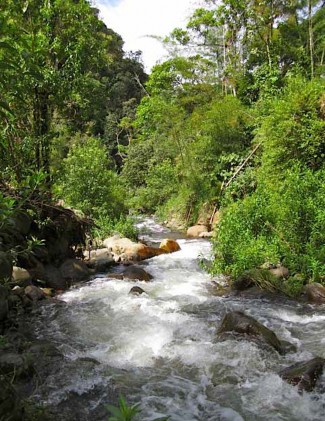
Water Regulation
This category includes regulation of water flows
through the ground and along terrestrial surfaces, as
well as regulation of temperature, dissolved minerals,
and oxygen. Ecosystems absorb water during rains
and release it in dry times. They also regulate water
temperature and flow for plant and animal species.
Forest cover, riparian vegetation and wetlands all
contribute to modulating the flow of water from
upper portions of the watershed to streams and rivers
in the lower watershed.

When forested basins are heavily harvested, the remaining vegetation and litter layer on the forest floor absorbs less water. Because the ground's capacity to absorb water is reduced, more water flows over the land and into streams and rivers. This
contributes to higher peak flows, flood events, erosion and landslide issues, as well as lower low flows in summer months, because the water was not retained in natural system.80

Local villagers near the Penaherra-Cristal micro-
watershed usually take 20-minute walks to healthier
sections of the forest that provide the materials
needed for everyday use.81 Nearby vegetation
providing these items are scarce, mostly due to the
clearing of the vegetation in order to develop lands
near the villages. According to recent updates, it was
estimated that 30-40 percent of land is in urgent need
of reforestation.
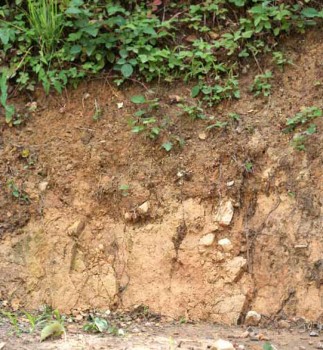
Soil Retention
Soil serves a vital function in nature. It provides a
medium for plant and nutrient growth as well as
habitat for millions of micro- and macro-organisms.
Healthy soils are able to store water and nutrients,
regulate water flow and neutralize pollutants more
efficiently than degraded soils.82 In this sense, soil
retention reinforces a number of other ecosystem
services, including disturbance prevention and the
provisioning of raw materials.
The soil retention properties of ecosystems determine the rate of erosion, and thus soil retention is closely linked with preventing disturbances such as landslides, which are often caused by excessive erosion and

can be attributed to human land use. In many areas, vegetation can prevent landslides and harmful erosion. The susceptibility of a given slope to erosion is determined by grain size, soil cohesion, slope gradient, rainfall frequency and intensity, surface composition and permeability, and type of land cover. A forest's organic layers absorb water during periods of heavy precipitation, acting as a natural sponge and preventing erosion. In areas where active forestry occurs, the upper layers of soil are often removed or degraded.
As part of the western slopes of Ecuador's northern
Andes, the Intag region consists of steep slopes and
great canyons.
Soil erosion mainly occurs in elevations below 3,400 meters in Intag.83 This is primarily due to loss of original forest cover and conversion of land to agriculture.
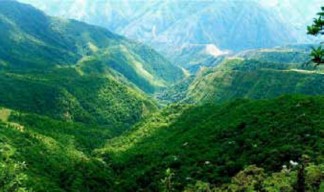
Soil Formation
Soil quality and abundance is critical for human
survival, yet human actions can also affect nature's
ability to provide high-quality soils. There are
generally five elements that influence the type and
characteristics of soils: parent material, topography,
living organisms, climate, and time characteristics.84

For the most part, parent material is chemically
weathered mineral or organic matter that contributes
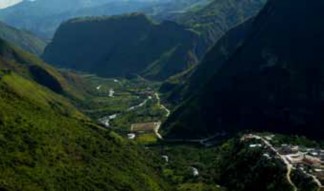
to soil formation. In the Intag zone, the topsoil is rich
in organic matter, though in certain regions where the
organic matter has not weathered, the soil is formed

from silty and sandy deposits. Volcanoes in the region
have significantly contributed to the area's relatively
rich soils.

The climate is the overarching factor for observed altitudinal differences in soil development by affecting the leaching regime and organic matter decomposition. Climate in the Intag region is that of an equatorial high altitude environment (within 50 km of the Equator) where temperatures stay within a smaller range throughout the year. The Intag and Manduriacos regions have a wide altitudinal range from 650 m to 4,000 m, where the mean annual
temperature is about 15°C. At much higher elevations, temperatures drop by 0.6°C for every 100 meters.
![]()
Like much of the Andean Tropics, Intag has an average rainfall of 1,000 mm to 3,000 mm.
Time is absolutely essential to soil formation. In the volcanic complex of Cotacachi, located east of Intag, there has been a long history of volcanic activity involving several different eruption centers. Closest
to Intag, ancient volcanic lake Cuicocha has had three phases of activity, which occurred over a period of
a few hundred years, ending at around year 3,000 BP.vi Calderas formed by explosive eruptions result in pyroclastic flows, or massive fast-moving currents of hot gas and ash, that spread throughout the area of the volcano and deposit tephra in a thin blanket.
![]()
Before Present (BP) years is a time scale used in archaeology, geology, and other scientific disciplines to specify when events in the past occurred.
Nutrient Regulation

The transfer of nutrients from one place to another
and transformation of critical nutrients from unusable
to usable forms is an essential ecosystem service.
There are 22 essential elements for the growth and
maintenance of living organisms. All living things
depend on the nutrient cycles of carbon, oxygen,
nitrogen, phosphorous, and sulfur in relatively large
quantities. These are also the nutrient cycles that
human actions have most affected. Silicon and iron are
important elements in oceanic nutrient cycles because
they affect phytoplankton community composition
and productivity. Natural processes facilitate
the movement of nutrients and turn them from
biologically unavailable forms, such as rocks or gases
in the atmosphere, into forms that can be used by
other living things. Nutrient cycling is a fundamental
precursor to ecosystem and economic productivity.
Without functioning nutrient cycles, life on the planet
would cease to exist.
Living organisms mediate nutrient regulation. On land, plants depend on biologically-mediated breakdown
of organic matter to make the nutrients they need for growth available. As plants and plant parts die, they contribute to the pool of organic matter that feeds the microbial, fungal, and micro-invertebrate communities in soils. Underground fungal structures
can also provide support to living plants-for example, young trees may not receive enough nutrients through sunlight because mature trees block sunlight, but can instead draw nutrients from mycorrhizal structures hundreds of yards away.85 Such communities facilitate the transformation of nutrients from one form to another. Larger animals play a crucial role in nutrient cycles by moving nutrients from one place to another in the form of excrement, and the decomposition of their bodies after they die. Animals also play a role in transporting nutrients between terrestrial and aquatic environments.
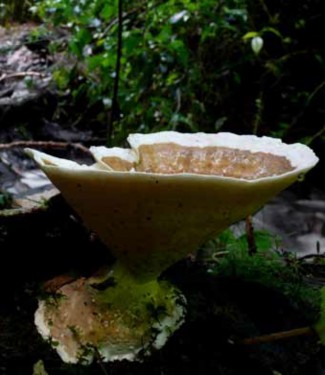

In montane tropical forests nutrient availability is
determined by temperature and precipitation among
other factors. However, limiting nutrients control the
overall growth of this ecosystem and the thriving of
specific species able to adapt to these limitations. The
major components of net primary production (NPP) in
tropical montane forests are, in order of importance,
above- ground litterfall, root production, and, to a
much lesser extent, wood increment. Intag, like other
montane forests, depends immensely on the amount
of litterfall for the nutrients optimal distribution.
Reduction in foliar coverage will affect the NPP of the
entire ecosystem, creating disastrous rippling effects.86

Waste Treatment

Microorganisms in sediments, soils, and wetlands
break down human and other animal wastes.87 They
can also slowly detoxify petroleum products. The
physical destruction of habitat, alteration of food
webs, or overload of nutrients or waste products
disrupts disease regulation and waste processing
services. Alteration of ecosystems can also create
breeding sites for disease vectors where they were
once nonexistent. People can be exposed to disease
in areas through direct contact with bacterial or
viral agents while swimming or washing in fresh or
saltwater, and by ingesting contaminated fish, seafood
or water.
Wetlands, estuarine macro algae, and near-shore sedimentary biota play a crucial role in removing nitrogen and phosphorous from water.88 The removal of these nutrients maintains offshore water conditions that are conducive to healthy native fish and invertebrate biota.
Decomposition rates are rapid in tropical forests
characterized by high, constant temperatures and
high annual rainfall. However seasonal droughts limit
decomposition rates in many tropical forests. Water
affects decomposition directly through leaching and
indirectly though effect on microbial decomposers.
Intag's forests and other vegetative biotypes influence
the area's climatic system, thereby reducing casual
effects such as droughts, as well as providing forest
soils with necessary elements to regenerate, and for
decomposition, making essential nutrients available to
other organisms.89
Biological Control
Biological Control is the ability of ecosystems to
limit the prevalence of crop and livestock pests and
diseases. A wide variety of pest species destroy
human agricultural crops, reducing worldwide harvest
by an estimated 42 percent, thereby causing a loss of
$244 billion dollars each year.90 A number of natural
predators for pest species contribute to natural
control of damages. These predators also play a role
in protecting forests from pests. Birds, for example,
are natural predators of many harmful insects.
In recent years, humans have increasingly used
pesticides to control crop losses. While pesticides
can reduce the risk of specific pest attacks, they can
also harm natural predator populations and lead to
resistance among pests, making them even more
difficult to control in the future. Overuse of pesticides
is also known to reduce provisioning of some other

ecosystem services, particularly water quality. As
agriculture makes up the majority of economic
activity in Intag, pesticides have traditionally been
used heavily, notably tomatoes, Tree Tomatoes
(Cyphomandra betacea) and Naranjilla (Solanum
sp.), which has taken a heavy toll on biodiversity and
accessible drinking water.91

While there may be a role for pesticide control in agricultural practice, there are also ways to manage crops to enhance biological control services. Local grassroots organizations have stepped in and gathered funding in order to educate the regional farmers and help the community purchase and protect local watersheds. Several workshops have been held to educate the public on the impacts of pesticides and sustainable farming in Intag.92 These workshops discuss techniques that include crop diversification and genetic diversity, crop rotation, and promoting an abundance of smaller patches of fields.93
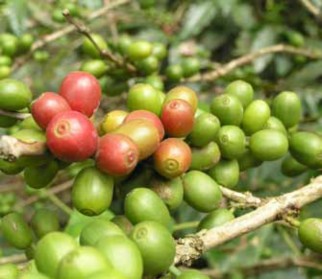
Pollination
Pollination is essential to agricultural crops, trees,
and flowers, little is known about the status of many
pollinator species specific to the Intag region. It is
the role that insects, birds, mammals and, in some
cases, the wind, play in transporting pollen grains to
fertilize plants. People depend on pollination directly
for food and fiber, and indirectly as part of ecosystem
productivity. Many plant species would go extinct
without animal- and insect-mediated pollination.
Pollination services by wild animals are also crucial for
crop productivity for many types of cultivated foods,
enhancing the basic productivity and economic value
of agriculture.94
The importance of wild pollinators to food crops means that wild habitats near croplands are necessary in order to provide sufficient habitat to keep populations of pollinators intact. Recent research on coffee agrosystems in Costa Rica have shown that the pollination services provided by pollinators nesting
in forest patches adjacent to coffee plantations may contribute to substantially greater yields of coffee.95 Dr. Taylor Ricketts and a group of scientists from Stanford University and the World Wildlife Fund found that coffee fields near tropical forest fragments had higher productivity yields than coffee fields more distant from the forest. In their case study, they found that coffee farmers beyond 1 km from forest suffered 20 percent lower yields due to inadequate pollination services.96
Coffee is an important agricultural product for

many families in the Imbabura Province. Coffee
production relies on the diversity of animal and
insect pollination. Each farmer protects a small forest
on his cultivable land, which allows for habitat of
wildlife, including pollinators, and also protects the
farmland from erosion. All members of the coffee co-
op (AACRI) are required to grow crops under shade
trees.
Habitat Refugium and Nursery
Habitat is the biophysical space and process in which
wild species meet their needs-a healthy ecosystem
provides physical structure, adequate food availability,
appropriate chemical and temperature regimes,
and protection from predators. Habitat may provide
refugium and nursery functions; a refugium refers
to general living space for organisms, while nursery
habitat is specifically where all the requirements for
successful reproduction occur.73 Biodiversity provides
the structure and complexity of ecosystems lending
resiliency and producing provisioning, regulating,
cultural and supporting ecosystem services. In
addition to the physical structure provided to species,
food/web relationships are important components of
habitats that support all species.
Ecuador is ranked as one of the 17 most biodiverse
countries in the world.97 The Intag region is located
within the Tropical Andes biological hotspot and
Tumbes-Choc6-Magdalena biological hotspot.98 The
Tropical Andes hotspot has been identified as the
richest and most diverse region on Earth.45 This region
contains about a sixth of all plant life in less than

one percent of the world's land area, and is home to
several endangered and threatened species including
the Yellow-eared parrot (Ognorhynchus icterotis),
Yellow-tailed woolly monkey (Oreonax flavicauda),
and Spectacled bear (Tremarctos ornatus).45 The
Tumbes-Choc6-Magdalena hotspot is home to the
bare-necked umbrella bird and the endangered white-

winged guan of southern Ecuador. Many species
in the area are threatened or are declining due to
urbanization, hunting, and deforestation.45
Food
Providing food is one of the most important
ecosystem functions. Agricultural lands are our
primary source of food; farms are considered modified
ecosystems, and food is considered an ecosystem
good with labor and built capital inputs. Agricultural
value is measured by the total market value of crops
produced; however, market value is only a small
portion of the total value agricultural lands provide
through pollination, carbon sequestration, aesthetic
value, and other services.
Fifty percent of Intag has been converted to small and
medium farms. Even in the steep and mountainous

area, approximately 90 percent of the population
owns land that is farmed. Farm sizes range from 1
to 50 hectares, where a variety of crops are grown,
including fruits such as citruses, papayas, pineapples,
blackberries, plantains; and vegetables such as broad
beans, peas, yuca (Manihot esculenta), camote
(lpomoea sp.), carrots, potatoes, avocados, tree
tomatoes, beans, and corn.vii Although most of the
crops are used locally, growing portions are sold in
regional markets such as Otavalo. Other cultivated
products include sugar cane, coffee and cabuya
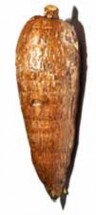
(Furcraea sp.).
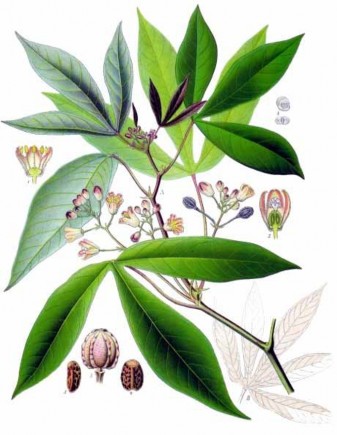
Yuca (Manihot esculenta)
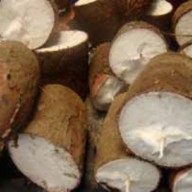
![]()
vii
This is a partial list of the diverse crops grown on a typical farm.
Water Supply
Watersheds produce water, including surface
water and groundwater for rural and metropolitan
areas. The hydrological cycle is affected by
structural elements of a watershed, such as forests,
wetlands, and geology, as well as processes, such
as evapotranspiration and climate. According to the
UNEP; over 60 percent of the world's population
gets their drinking water from forested watersheds.
The total rainfall per person in Ecuador is 43,000
cubic meters, which is three times the world

average rainfall.99 Yet only 36.8 percent of the
country's population has access to potable water
and, on average, 41.8 percent has access to sewage
services.*)) The rainfall figure is misleading because
water resources are not distributed evenly over the
year, geographically, or throughout the population.

Increasing loss of forest cover around the world has
decreased water supply due to lower groundwater
recharge and to lower flow reliability.*)*
Ecuador has been a pioneer in water economics. Below are three case studies of successful national water projects that have proven users' interest in protecting local watersheds.
viii
for watershed conservation at the Condor Bioreserve.
The fund was created in 2000 by voluntary
contributions from water users and increased up to
US $1.65 million from 2001-2005. During this time
period, it provided for watershed services, forest
protection, and compensation to 27,000 reserve
residents.*))
water. The municipality pays 27 households living on the banks of the Palaurco River for water quality and quantity protection, as well as forest and paramo protection and regeneration. The payment is financed with a 20 percent consumption fee paid by water users in Pimampiro and the interests generated by a fund with an initial capital of US $15,000.*)(
the slopes around the lake has led to a drop in the lake's water level (5 meters in last 10 years) and there are concerns about future water availability. The Municipal Company for Drinking Water and Waste Treatment and irrigation users began compensating people in the micro-valleys within the slopes of Mojanda for improving management such as agroforestry practices and commercial plantations reforesting using native species.103

Cloud forests are unique in their ability to store
water. As tropic weather heads east from the Pacific
Ocean, more water is pushed inland and moisture is
forced up the Andes mountain ranges. Cloud forests
in tropical areas store water ranging from 3,000 to
50,000 liters per hectare.104 Recent studies show how
clearing rain forests impacts local climates as far as 50
km away.105 As winds move across cleared lowlands,
clouds are lifted higher over the mountains. Fewer
clouds form over the forests, leading to less rainfall
and a cycle of dying forests, changing vegetation
growth and wind patterns.
viii Fundaci6n Antisana (a local NGO)
![]() , USAID, The Nature Conservancy and Ecodecision (a local environmental organization)
, USAID, The Nature Conservancy and Ecodecision (a local environmental organization)
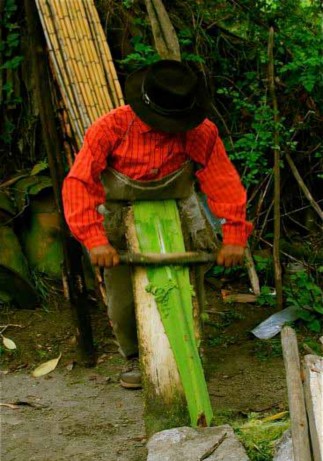
Raw Materials
Raw materials include biological materials used for
medicines, fuel, art, and building, as well as geological
materials used for construction or other purposes.
Crude oil, natural gas, and other fossil fuels are not
considered in this category because they are not
renewable.

The agave plant, locally known as Cabuya, is an
extremely useful plant. The plant is primarily used for
fibers from the leaf (sisal). Useful goods are produced
with the sisal, such as baskets, purses, belts, hats, and
even iPad covers. Vegetable ivory (Phytelephas sp.),
known as Tagua in Ecuador, is used in a wide variety
of products such as handicrafts and jewelry. The Tagua
has become an important substitute for elephant
ivory. The women's group, Mujer y Ambiente, has
been producing hand made handicrafts since 1993.
They meet once a month to share techniques and to
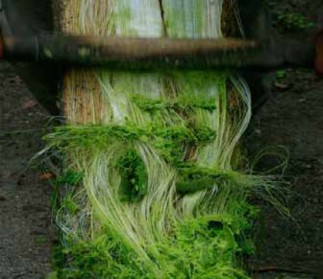
talk about events happening in the area.
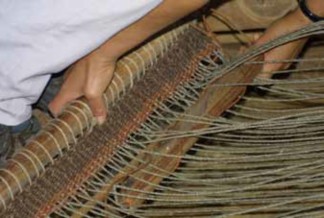

Genetic Resources
Genetic resources represent an ecosystem service
in itself because novel, valuable products have been
derived from genetic and chemical properties of
species. Genetic resources provide a secure food
base (multiple sources of food with different seasonal
availability). Recent developments in plant biology
have allowed scientists to study the patterns of
evolution, which allow flora to adapt and coexist
with newly introduced pests, pesticides, fertilizers,
and climates. Genetic material has yet to be fully
understood and thus potential applications of
endangered plant species provide a significant enough
reason to preserve them.
The Tropical Andes biological hotspot supports 664
distinct species of amphibians, the largest variety in
the world, with almost 450 amphibian species listed
as threatened on the 2004 IUCN Red List.45
Aesthetic and Recreational
Aesthetic value, as an ecosystem service, refers to
the appreciation of natural land and seascapes. The
existence of national parks and designated scenic
areas attests to the social importance of this service.
There is also substantial evidence demonstrating the
economic value of environmental aesthetics through
analysis of data on tourism, housing markets, wages,
and relocation decisions. Degraded landscapes are
frequently associated with economic decline and
stagnation.106
Intag's unique environment is becoming increasingly
popular as a tourist destination. Notably, according
to the Intag Cloud Forest Reserve, there are 219 bird
species, with more added every year.
According to a U.S. AID Report, tourism in Ecuador is the third largest source of foreign exchange and
provides employment for nearly three percent of the economically active population, accounting for nearly 400,000 jobs.97 The Ecotourism Network of Intag
(REI) is made up of 13 organizations based in Intag's parishes. REI hopes local, national, and international tourists will begin to recognize Intag. At the moment, tourism in Intag is underdeveloped compared with the Galapagos and the Amazon. Efforts are underway to map trails in the Intag region to market Intag to tourists who visit Otavalo.
From the Galapagos Islands to the Pacific coast, Pacific slope, paramo, eastern slope, and tropical forests, Ecuador has a tremendous diversity of spectacular tourist opportunities. This represents a substantial opportunity for economic development and foreign cash infusion in many areas of the country.
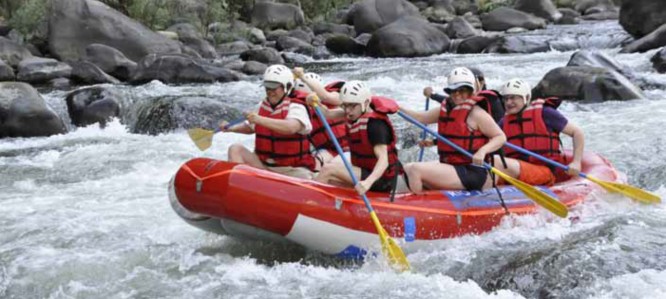

Scientific and Educational
The number of educational and research institutions
devoted to studying marine and terrestrial
environments shows the scientific and educational
importance of ecosystems. Government, academic,
and private resources are all devoted to formally
studying ecosystems in the Intag region. Such pursuits
benefit people through direct knowledge gained for
subsistence.
Several social, scientific, and educational institutions
devoted to terrestrial environments collaborate
and aid local communities that rely on the Intag
Forest Region. They also provide locally significant
employment. DECOIN, Xarxa, Rainforest Concern,
GEO schutzt den Regenwald e.V., the Sloth Club are
just some of a long list of organizations involved in
supporting Intag's communities. University study
abroad organizations, such as Global Learning, are
also becoming an important source of support for
the emerging nature-based and solidarity tourism
initiatives.
Camera trapping methods have recently been used in several regions of the Andes Mountains to estimate the density of specific and possibly endangered species of animal. In one study, 15 Andean Bears were identified from camera trap photos feeding on wild avocadoes.107
Various universities conducted field studies in or around Intag, including the University of Sussex, which looked at conservation efforts for the brown-headed spider monkey (Ateles fusciceps).108
Medicinal Resource
Medicinal resources are rarely valued in ecosystem
service literature or in traditional economic analyses.
Maintaining ecological diversity is crucial to ensuring
the availability of genetic and biological resources
for future medical discoveries. About 25 percent
of mainstream drugs used by Western medicine
come from the rainforest. The U.S. National Cancer
Institute has reported than more than two-thirds
of all medicines with cancer-fighting properties
have come from rainforest plants.109 Additionally,
at least ten billion dollars per year in research
are spent in Western countries.**) Scientists are
looking to nature to find the cure to cancer. These
efforts include studying bears and their habits of
hibernation for treatment for kidney failure, and
studying fungi, Cordyceps, as a potential alternative
to treating Chagas, a disease common in Central in
South America. Despite this, less than one percent
of tropical rainforest plant species have been
investigated for their potential use as therapeutic
agents.

Quinine is an organic chemical derived from the bark
of the cinchona tree (Cinchona rubra), which is native
to the Andean regions in South America. For nearly
400 years after its effectiveness was first documented,

Quinine was valuable for treating malaria for
hundreds of millions of people and in some parts of
the world it is still an important anti-malarial drug.

The Sangre de Drago is a latex-like sap that comes from the Croton species of tree found in Intag.
This medicinal sap was used for centuries by the indigenous peoples of the Amazon to treat various ailments, including diarrhea; ulcers in the mouth, throat, stomach, and intestines; upper respiratory viruses; cancer; and wounds.***
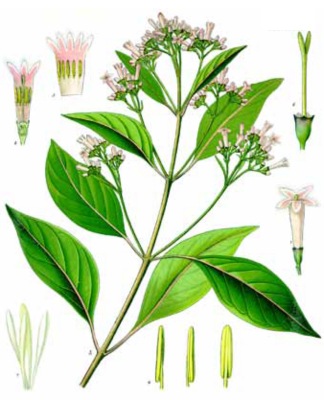
Cinchona tree (Cinchona rubra)
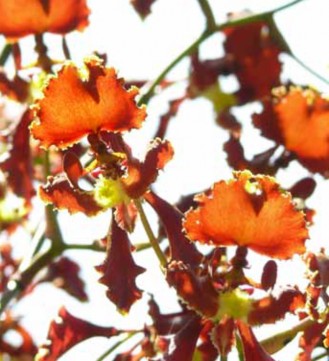
Ornamental resources
Ornamental resources are animal or plant products
used for fashion, decoration, and jewelry that
meet human needs through "aesthetic beauty and
intellectual stimulation that lift the human spirit".**(
Ecuador has the largest variety of orchids in the
world (declared in the International Orchid Expo
in Hannover, 2000).113 There are at least 4,215
different orchid species in the country. Besides
being an important tourist attraction, orchids are an
increasingly attractive export product for Ecuador,
with an estimated 60,000 orchids exported a year.114
Data from the Central Bank of Ecuador indicates that
31 percent of orchid exports went to Germany, 29
percent went to Singapore, 25 percent went to the
United States, and four percent went to Japan.115 The
biggest orchid exporter in Ecuador is Ecuagenera,
which exports around 40,000 plants each year, at
prices varying from $8 to $50 per plant. This exporter
alone provides between $320,000 to $2 million to
the Ecuadorian economy.116 The orchids grown in
Intag are mainly for personal use. It is also one of the
largest attractions for tourists who make the trek to
Intag.
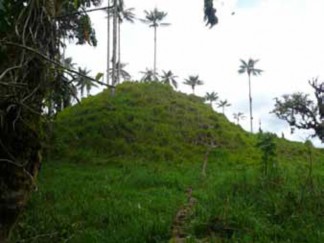
Cultural and Spiritual
Many natural areas have special value to native
people from a spiritual perspective, as evidenced
by indigenous traditions, stories, and art depicting
wildlife and natural systems. Non-native people also
tend to feel an emotional or spiritual connection
to the landscape in which they live. Spiritual and
religious values are impossible to assess monetarily,
as there is no real way to measure their quantity or
importance across individuals.
The use of "willingness to pay" surveys for natural goods and services, such as protection for whales or tropical species, reveals that many people rank the protection of nature above additional material gains. That is to say, they would choose protection over a monetary reward. Some respondents to such survey instruments give "protest bids," which indicate that they are not willing to put a finite price on saving wildlife or wild places.
![]()
The wealth of cultural history has barely been studied
in Intag. Before the Incas broadened their reign into
northern Ecuador, the Yumbo people inhabited a
region in the Imbabura and Pichincha provinces, just
north of Quito, from 800 to 1600 A.D.117 The Yumbo
Interpretation Centre attracts many visitors with its
burial mounds providing insight into the history of the
region.
!3 '&"( *3 >6 *16 0&1%6. ,& ;*J6 %9&)%63K
>6 *16 (&)"( ,91&-(9 ,96 <1&%633 &0 :*'-*,)&"A
-Robert Costanza ”
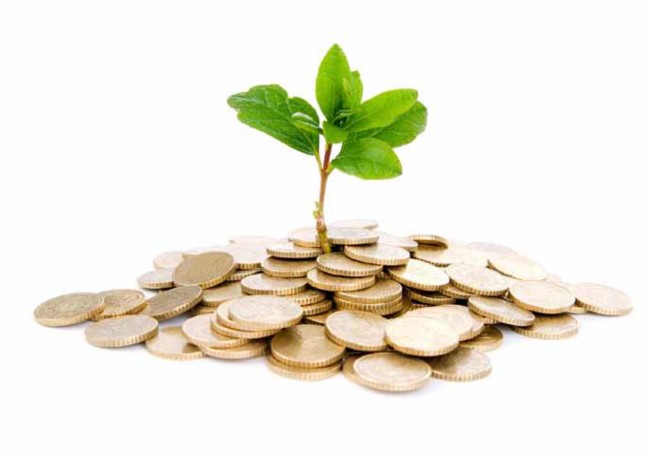
=*1, 4L
Valuation Analysis of the Intag Region

Section Summary: The economic value of ecosystem services generated in the lntag Region was estimated using the benefit transfer methodology. The results of this methodology indicate that ecosystem goods and services within lntag generate a large amount of monetary value to the economy.
![]()
The benefit transfer methodology was used to
conduct an economic valuation on Intag. This analysis
is a widely accepted economic methodology that

estimates the economic value of an ecological good
or service as determined by examining previous
valuation studies of similar goods or services in other
comparable locations. The study used on Intag uses
values from Ecuador, as well as values from similar
ecosystems elsewhere in the world.
Earth Economics manages a database of published, peer-reviewed ecosystem service valuation studies. Originally developed in partnership with the Gund Institute for Ecological Economics at the University of Vermont, the database provides value transfer estimates based on land cover types and is regularly updated.
The value of the ecosystem services is additive. A hectare of forestland provides water regulation and filtration services, as well as aesthetic, flood protection and refugium benefits. One study may establish the value per hectare of a watershed in
water filtration for a drinking water supply. Another study may examine the value per acre of refugium for wildlife. To determine the full per-acre value provided by a vegetation type, ecosystem service values are summed up and multiplied by the acreage.
The valuation techniques utilized to derive the values in the database were developed primarily within environmental and natural resource economics, and include direct use value and indirect use value. Direct use value involves interaction with the ecosystem itself rather than via the services it provides. It may be a consumptive use, such as the harvesting of trees or fish, or it may be non-consumptive use, such as hiking, bird watching, or educational activities. This value is often determined by market exchange values of goods produced or costs associated with enjoying the resource.
Indirect use value is derived from services provided by the ecosystem when direct values are not available. This may include the removal of nutrients, providing cleaner water down stream (water filtration), or the prevention of downstream flooding. Studies may derive values from associated market prices such as property values or travel costs. Values can also be derived from substitute costs like the cost of building
a water filtration plant when natural ecosystem filtration services are disturbed and fail. Contingent valuation is an additional method that entails asking individuals or groups what they are willing to pay
for a good or service. Table 9 describes the primary valuation methods used in this report.
Table 9: Methods for Primary Research in Ecosystem Service Valuation.
Direct Use Values | |
Market Price | Prices set in the marketplace appropriately reflect the value to the "marginal buyer." The price of a good tells us how much society would gain (or lose) if a little more (or less) of the good were made available. Example: Rainforest products such as coifee and cacao. |
Indirect Use Values | |
Avoided Cost | Value of costs avoided by ecosystem services that would have been incurred in the absence of those services. Example: Hurricane protection provided by barrier islands avoids property damages along the coast. |
Replacement Cost | Cost of replacing ecosystem services with man-made systems. Example: Natural water filtration replaced with costly man-made filtration plant. |
Factor Income | The enhancement of income by ecosystem service provision. Example: Water quality improvements increase commercial fisheries catch and incomes of fishermen. |
Travel Cost | Cost of travel required to consume or enjoy ecosystem services. Travel costs can reflect the implied value of the service. Example: Recreation areas attract tourists whose value placed on that area must be at least what they were willing to pay to travel to it. |
Hedonic Pricing | The reflection of service demand in the prices people will pay for associated goods. Example: Housing prices along the coastline tend to exceed the prices of inland homes. |
Contingent Valuation | Value for service demand elicited by posing hypothetical scenarios that involve some valuation of land use alternatives. Example: People would be willing to pay for increased preservation of beaches and shoreline. |
Group Valuation | Discourse-based contingent valuation, which is arrived at by bringing together a group of stakeholders to discuss values to depict society's willingness to pay. Example: Government, citizen's groups, businesses come together to determine the value of an area and the services it provides. |
The total area of the Intag region is roughly 150,000
hectares. Geographic Information Systems (GIS) data
on land cover (forests, bamboo, rivers, pastures) is
provided by satellite surveys. These land cover types
provide suites of ecosystem services that we can
value. One challenge of gathering GIS data in a region
like Intag is that cloud forests tend to limit satellite

coverage. Satellite information was not available for
27,643 ha of the Intag area because of cloud cover.
This is important to note because it means that the
values presented in this study are undervalued. The
area valued totaled 123,528 hectares or 82 percent
![]()
of the total area (18 percent of the land area was
![]()
obscured by clouds when satellite photos were taken, those photos were the basis for the GIS analysis).
Land cover data derived from EcoPar, an environmental non-profit organization based in Ecuador, reflects the best available GIS data for the Intag region. The following table shows GIS land cover type and area for each class in the region. The vegetation data was realized in 2008 using Landsat and Aster images in 2002 and 2007, respectively. Cloud forests and agricultural lands mainly cover the
Intag region. Figure 8 shows the geographic boundary of the study site.
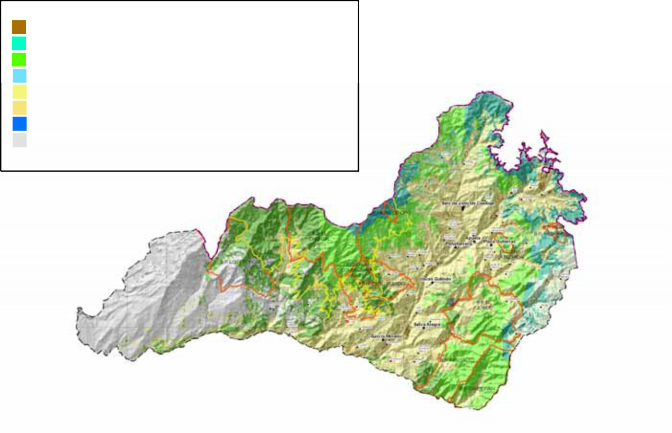
Figure 8: Map and Acreage of Intag Region by Land Cover Class (2008)
Land Cover Types Agricultural Lands | Hectares 3,432 |
Bamboo | 1,900 |
Cloud Forests | 60,965 |
Native Andean Alpine Grasslands | 4,373 |
Pasture | 18,932 |
Pasture and Agricultural | 33,818 |
Rivers and Lakes | 108 |
No Data (cloud covered) | 27,643 |
Total | 151,171 |
Source: EcoPar, Fernando Espinosa
Table 10: Ecosystem Services Identified and Valued in Intag
Agricultural lands | Grasslands | Lakes/Rivers | Pasture | Pasture/Agricultural | Bamboo | Cloud Forest | |
Aesthetic and Recreational | x | x | x | x | |||
Biological Control | x | x | x | ||||
Cultural and Spiritual | |||||||
Disturbance Regulation | |||||||
Erosion Control | x | x | x | ||||
Gas and Climate Regulation | x | x | x | x | |||
Genetic Resources | x | ||||||
Habitat Refugium & Nursery | x | x | x | x | |||
Medicinal Resources | |||||||
Nutrient Cycling | x | x | |||||
Pollination | x | x | x | x | |||
Raw Materials | x | x | x | ||||
Soil Formation | x | x | x | x | x | x | |
Waste Treatment | x | x | x | x | |||
Water Regulation | x | x | x | ||||
Water Supply | x | x | x | x | |||
Food Production | x | x | x | x | x |
![]() Ecosystem service produced but ,%# valued in this report
Ecosystem service produced but ,%# valued in this report
![]()
![]()
x Ecosystem service produced and valued in this report Ecosystem service not produced by land cover class
to place a monetary value on the ecosystem service identified; or (3) It is impossible to place a value on some services, such as cultural and spiritual services. The following table identifies which services were valued in this study by land cover type.
The following series of tables provide high and low
valuation results per hectare by land cover type. All
values are adjusted for inflation and are presented in
2009 US dollar per hectare per year units.
Appendices C-D describe the land cover type, ecosystem service, authors of papers used in this study, the lowest and the highest values known for each value utilized in this study. There is also a single value column where low and high values do not exist.
Table 11: High and Low Estimates for Agricultural Lands
Bamboo (per ha) | ||
Min | Max | |
Aesthetic and Recreational | ||
Biological Control | ||
Erosion Control | ||
Gas and Climate Regulation | $474.45 | $615.01 |
Genetic Resources | ||
Habitat Refugium and Nursery | $572.85 | $572.85 |
Nutrient Cycling | ||
Pollination | ||
Raw Materials | $456.86 | $456.86 |
Soil Formation | $676.24 | $676.24 |
Waste Treatment | $230.19 | $230.19 |
Water Regulation | ||
Water Supply | $562.14 | $562.14 |
Food Production | ||
3%#<. | $2,972.73 | $3,113.29 |
Table 12: High and Low Estimates for Bamboo
Agricultural Lands (per ha) | ||
Min | Max | |
Aesthetic and Recreational | $72.03 | $72.03 |
Biological Control | ||
Erosion Control | $14.16 | $14.16 |
Gas and Climate Regulation | $27.70 | $774.00 |
Genetic Resources | ||
Habitat Refugium and Nursery | ||
Nutrient Cycling | $54.27 | $54.27 |
Pollination | $6.29 | $419.41 |
Raw Materials | $988.65 | $2,525.28 |
Soil Formation | $14.16 | $14.16 |
Waste Treatment | ||
Water Regulation | ||
Water Supply | ||
Food Production | $384.47 | $10,512.64 |
3%#<. | $1,561.73 | $14,385.95 |
Table 13: High and Low Estimates for Cloud Forests
Pasture (per ha) | ||
Min | Max | |
Aesthetic and Recreational Biological Control | $3,423.68 $3,423.68 | $3,423.68 $3,423.68 |
Erosion Control | $3,423.68 | $3,423.68 |
Gas and Climate Regulation | $3,423.68 | $3,423.68 |
Genetic Resources | $3,423.68 | $3,423.68 |
Habitat Refugium and Nursery | $3,423.68 | $3,423.68 |
Nutrient Cycling | $3,423.68 | $3,423.68 |
Pollination | $3,423.68 | $3,423.68 |
Raw Materials | $3,423.68 | $3,423.68 |
Soil Formation | $16.29 | $16.29 |
Waste Treatment | $3,423.68 | $3,423.68 |
Water Regulation | $3,423.68 | $3,423.68 |
Water Supply | $3,423.68 | $3,423.68 |
Food Production | $3,423.68 | $3,423.68 |
3%#<. | $16.29 | $16.29 |
Table 14: High and Low Estimates for Pasture
Cloud Forests (per ha) | ||
Min | Max | |
Aesthetic and Recreational Biological Control | $3.68 $5.68 | $766.06 $23.55 |
Erosion Control | $6.82 | $958.89 |
Gas and Climate Regulation | $26.12 | $623.02 |
Genetic Resources | $1.73 | $253.84 |
Habitat Refugium and Nursery | $2.59 | $1,342.82 |
Nutrient Cycling | $514.55 | $1,346.65 |
Pollination | $3.10 | $654.83 |
Raw Materials | $11.21 | $3,423.68 |
Soil Formation | $10.01 | $14.26 |
Waste Treatment | $86.51 | $259.52 |
Water Regulation | $25.17 | $76.65 |
Water Supply | $3.10 | $10.58 |
Food Production | $8.38 | $2,659.22 |
3%#<. | $708.65 | $12,413.57 |
Table 15: High and Low Estimates for Pasture and Agricultural
Native Andean Alpine Grasslands (per ha) | ||
Min | Max | |
Aesthetic and Recreational Biological Control | $22.61 | $33.16 |
Erosion Control | $41.83 | $44.21 |
Gas and Climate Regulation | $9.41 | $397.35 |
Genetic Resources | ||
Habitat Refugium and Nursery | $3.10 | $3.10 |
Nutrient Cycling | ||
Pollination | $25.01 | $36.07 |
Raw Materials | ||
Soil Formation | $1.21 | $1.44 |
Waste Treatment | $7.48 | $125.49 |
Water Regulation | $4.32 | $5.02 |
Water Supply | $3.10 | $14.95 |
Food Production | $57.03 | $57.03 |
3%#<. | $175.11 | $717.81 |
Table 16: High and Low Estimates for Native Andean Alpine Grassland
Pasture and Agricultural (per ha) | ||
Min | Max | |
Aesthetic and Recreational Biological Control | $63.68 $33.51 | $63.68 $33.51 |
Erosion Control | ||
Gas and Climate Regulation | ||
Genetic Resources | ||
Habitat Refugium and Nursery | ||
Nutrient Cycling | ||
Pollination | $5.56 | $28.02 |
Raw Materials | ||
Soil Formation | $1.41 | $1.41 |
Waste Treatment | ||
Water Regulation | ||
Water Supply | ||
Food Production | $86.26 | $86.26 |
3%#<. | $190.42 | $212.88 |
Rivers and Lakes (per ha) | ||
Min | Max | |
Aesthetic and Recreational | $33.87 | $51,597.93 |
Biological Control | ||
Erosion Control | ||
Gas and Climate Regulation | ||
Genetic Resources | ||
Habitat Refugium and Nursery | $42.33 | $42.33 |
Nutrient Cycling | ||
Pollination | ||
Raw Materials | ||
Soil Formation | ||
Waste Treatment | $183.92 | $2,391.04 |
Water Regulation | $3,697.88 | $6,466.48 |
Water Supply | $79.91 | $14,641.83 |
Food Production | $40.99 | $40.99 |
3%#<. | $4,078.91 | $75,180.60 |
Table 17: High and Low Estimates for Rivers and Lakes
Per hectare values were summed for each land cover class across ecosystem services. Table 18 shows the acreage value of each vegetation type within the region, the total $ per hectare for that vegetation type across the ecosystem services where values exist. Because no valuation studies for sum vegetation type per ecosystem service value combinations exist for some services, these are clearly underestimates.
![]()
Table 18: Annual Ecosystem Service Value Flows for the Intag Region
Acreage | Low and High Values (per Acre) | Low and High Totals (Values x Acreage) | |||
Land Cover Types | Hectares | Low | High | Low | High |
Agricultural Lands | 3,432 | $1,561.73 | $14,385.95 | $5,359,864.44 | $49,372,582.60 |
Bamboo | 1,900 | $2,972.73 | $3,113.29 | $5,648,187.00 | $5,915,251.00 |
Cloud Forests | 60,965 | $708.65 | $12,413.57 | $43,203,021.44 | $756,793,127.50 |
Native Andean Alpine Grasslands | 4,373 | $175.11 | $717.81 | $765,743.02 | $3,138,989.33 |
Pasture | 18,932 | $16.29 | $16.29 | $308,443.02 | $308,443.02 |
Pasture and Agricultural | 33,818 | $190.42 | $212.88 | $6,439,603.47 | $7,199,219.29 |
Rivers and Lakes | 108 | $4,078.91 | $75,180.60 | $440,522.14 | $8,119,504.91 |
No Data | 27,643 | - | - | - | - |
Total | 151,171 | $62,165,384.53 | $830,847,117.65 | ||

The annual flow of value shown by the partial
valuation of 17 ecosystem services across seven land
cover types in the Intag region is roughly between $62
million and $831 million. The low and high estimates
are both underestimated because several ecosystem
services have not been included; these services are
appreciating in value and for other reasons noted in
Appendix A. This represents significant development
and income opportunity for the region and a basis for
sustainable economic development.
From this annual flow of value, a capital asset value analogous to an "asset value" can be calculated. This is the difference between the sum of monthly mortgage payments across the year (an annual flow of value for living in the house for one year) and the full sale value of a house (the asset value or present

value). To determine the present value of ecosystems to society, we apply a depreciation (or discount) rate of three-percent over 100 years from the present day. Applying a commonly used three-percent discount rate, we find that Intag's 17 ecosystem services that were examined provide an asset value between $3 billion and $28 billion. This shows there that the current natural and agricultural systems of the Intag region are tremendous national assets. Because natural assets appreciate, rather than depreciate, over time the discount rate is likely closer to zero.
Discount Rate (100 years) | Low Estimate (US$ billion) | High Estimate (US$ billion) |
0% | $6 | $83 |
3% | $3 | $28 |
Table 19: Present Value over 100 Years with Zero and Three Percent Discount Rates
The discount rate measures how much value current decision-makers give to future value production. A zero-percent discount rate implies that current flows of ecosystem services are just as important to future flows of ecosystem services. A three-percent discount rate implies that people today have a time preference
- what remains in the future is less important than what we have today.
Calculations of the present value of the flow of ecosystem services do show that intact natural systems provide enormous value to society in the short- and long-term. The present generation receives a relatively small amount of the total value provided by these systems. For example, the supply of drinking water for this year is critically important and clearly valuable, but is small in comparison to the total amount of water and value provided over a 100-
year period. Through time, future generations will cumulatively receive very large economic benefits from functioning natural capital.
Self-interested actions that damage the long-term productivity of these systems for short-term gain could result in vegetative destruction or ecological process changes that would degrade the ecological services provided. This would likely result in a substantial loss of benefits and potentially substantial costs incurred by public and private individuals and firms.

Even on the low side of these estimates, these values clearly support a significantly higher investment in conservation, which will produce higher real benefits for residents. The asset value of ecosystems in the Intag region certainly exceeds billions.
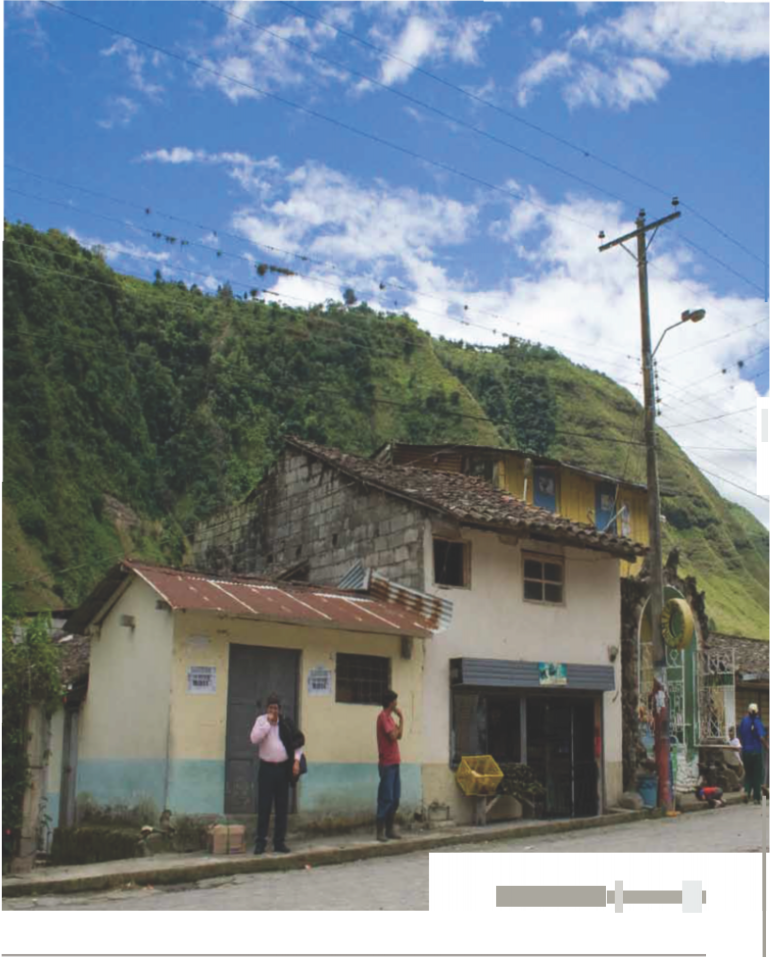
....
APuela, a small • ••
=*1, L
Implications and Recommendations

Section Summary: Economies depend upon ecosystem goods and services, and become weakened when regional ecosystems are degraded. The long-term health of the lntag Region and Ecuador depends upon our ability to make wise choices and investments that increase the productive capacity of the watershed's natural capital. Recommendations on how to understand and positively apply the results of this study are designated in bold text below.
Investing in the Future
Ecuadorian leadership has critical investment
decisions to make. The term "investment" describes
choices made today to allocate resources to generate
returns in the future. An economy is the product
of previous decades of investment. Even without a
catastrophic industrial accident, the cost of mining
production, remediation, and reclamation far
outweighs the short-term profits gained by mining in
this unique and sensitive region.
The city of Quito has a first-rate public transportation system, which surpasses those of many cities in
the United States. It is because leaders over 15 years ago invested in the bus rapid transit. When investing in this infrastructure, the city considered not only the short-term costs and benefits of local
transportation, but also the long-term investment in a world approaching peak oil. Ecuadorian leadership
should apply this same principle when making mining decisions for the Intag region.
Decision-Making Support
The large dollar values of ecosystem services in the
Intag region demonstrate the importance of natural
systems to the local economy. The appraisal values
identified in this study are defensible and applicable to
decision-making at every jurisdictional level.
Watershed Characterization
Watershed characterizations and other watershed-
based analyses should be a priority. Understanding
and documenting watershed boundaries and
flow is incredibly important to development in
the 21,. century. In recent years, characterization
methodologies have dramatically advanced to
recognize that human economy and ecosystem
services are crucial to understanding the value
and depth of watershed characterization. It is also
important that provincial and national agencies
adopt this analysis as a normal part of operations.
Training for academic institutions, private firms
(including consulting companies and nonprofits), and
government agencies in ecosystem service analysis
should proceed at a rapid pace.
Economic benefits provided by natural systems are important and need to be valued to properly inform public and private investment. These improvements in economic analysis, which promote better investment, are informed by ecosystem services. The mapping of ecosystem services on the landscape, their provisioning, beneficiaries, and impediments
all inform how institutions should be set up and how incentives and funding mechanisms should be created. Government funding mechanisms could be greatly improved by setting up mechanisms on the global scale, where beneficiaries in Europe, North America and Asia can compensate for the benefits of biodiversity, climate stability, and other global benefits provided by areas like Intag.
Cost/Benefit Analysis
A cost/benefit analysis is used to make investment
decisions in areas such as health care, levee
construction, education, road building, economic
development, and tax breaks. If a cost/benefit
analysis is flawed, investments will be flawed. For
example, a fish-processing plant counts as an asset in
cost/benefit analysis. However, United States' federal
rules do not recognize natural systems as assets.
Therefore it is not recognized or valued in the cost/
benefit analysis.
In the United States, the federal cost/benefit analysis rules (Principles and Guidelines) are currently being rewritten to include the value of natural systems
and ecosystem services. This will affect all federal agencies from the National Health Institute to the Army Corps of Engineers. The process is expected to take two years. It is Earth Economics' experience that
when local and regional jurisdictions factor natural capital into cost/benefit analysis, better-informed decisions result. When working with federal agencies on projects, local jurisdictions have an opportunity to take a leadership role.
Project Prioritization
Criteria for selection and prioritization of capital
infrastructure projects need to reflect the goals of the
communities and the policies of local jurisdictions.
Although not a comprehensive list of criteria, some
questions driven by ecosystem services-related
policies include:
Environmental Impact Statements Environmental impact statements (EISs) can affect project design and investment by identifying actions that reduce the negative environmental impacts
or enhance restoration. One of the fundamental
challenges of EISs is the lack of an economic
interface. In other words, environmental damages
can be quantified in scientific terms, but this has
no common language with project financing,
which is denominated in dollars. Ecosystem service
identification and valuation often strengthen the
weakest area of environmental planning and analysis:
providing an understanding of the economic benefits
and costs of conservation or restoration projects.
In 2010, the Peruvian congress passed a law requiring EISs for all development projects to include ecosystem service valuation. The Peruvian Ministry of Environment then requested Earth Economics' assistance in developing a robust valuation program, which utilizes web-based tools that can be run
by planning officials or local consultants. Earth Economics is currently developing a web-based tool called SERVES (Simple Effective Resource for Valuing Ecosystem Services) to do scenario valuation and will have an internal version of that tool in late 2011. Earth Economics is working with the Peruvian government
to fundraise to make this tool and the required training available to be used for all development projects in two pilot provinces in 2012.

Providing this valuation in EISs allows for a stronger understanding of the economic benefits the project provides. Identifying the dollar value of ecosystem services enhanced by the project and provided to the public also strengthens the capacity for funding proposals. Private and public institutions should
Environmental Bonds
Large-scale mining may cause health and
environmental impacts. History shows that without
including the potential costs of restoration, long-term
health, and environmental damage, taxpayers or local
communities may pay vast costs beyond the life of
the mine. The US EPA and other national institutions
have created environmental bonds so that the risk of
catastrophic or long-term damage can be included up
front in the costs of a risky project. The environmental
bond does three things. First, it provides an incentive
for companies to invest in technology and actions
that reduce the risk of damaging others and the
environment because as the risk of damage is

reduced, the size of the bond required is reduced. Second, it ensures that if there is severe damage, then sufficient funds have been set aside to repair and restore damaged areas and compensate people damaged by that action. Finally, environmental bonding shifts mining and other risky investments to areas where they have less risk of damaging people and sensitive environmental areas. For example, one aspect of the environmental bond for a mine in the Atacama Desert would be less than a bond in Intag, because there is less rainfall and potential risk for a flood event to wash mine waste into downstream communities. If mining does proceed, the size of the
Development of Funding Sources
The values included in this report are not spatially
explicit but they do provide reference values for
some of the ecosystem services that are produced by
comparable ecosystems to those in the Intag region.
A riparian restoration group, for example, might
like to apply for grant funding that would restore
100 acres of riparian forest. Using the values found
in Appendix C as a reference, they can perform a
simple calculation to show the increase in public
economic value generated by that land, thus showing
an economic return on investment to the region in
addition to the ecological Return on Investment (ROI).
Jobs Analysis
Ecosystem services and jobs are closely connected.
Examinations of jobs created by projects that
improve natural systems have economic importance.
Establishing an increase in permanent gainful

employment is far more important than providing temporary jobs. Jobs analysis (i.e. number of jobs
Towards a Sustainable and Desirable
>"#"&/
Infrastructure can be further integrated to satisfy
multiple goals (e.g. sustainability, economic
development, and flood protection) to provide a
better return on investment over time. Understanding
where and how to invest in a watershed is essential to
improving human wellbeing. Intag leaders can use the
concepts, values, and recommendations presented in
this study to begin incorporating ecosystem services
into agency goals, metrics, indicators, assessments,
and general operations. Examples include: developing
budgets and program planning, writing grant
applications to secure outside funding, examining
policies and accounting practices, designing and
reporting health indicators, and developing and
reviewing progressive permit processes in rural areas.
Yasuni Model

The Yasuni-ITT initiative is a proposal to protect Yasuni
National Park in the Ecuadorian Amazon rainforest
by leaving oil reserves underground and untouched
in return for the international community's
compensation for the forgone oil revenue.118 The
Ecuadorian government recognizes the need for a
post-petroleum economy and the Yasuni initiative
is a monumental step towards a more sustainable
development path. If successful, the model could be
replicated in the Intag region.
Next Steps
Earth Economics has been working with the visionary
community of Intag for two years to identify and
value the region's ecosystem services. This is the
first step in ecosystem service analysis. With further
investments in mapping, detailed scenario analysis,
accounting improvements, and policy research,
further innovations can be made to ensure Intag's
natural assets and the surrounding regions are managed for generations to come. To this end, we suggest the following next steps:
![]()
Develop further modeling and mapping capacity.
General, basin-wide investigation including
hydrological studies should be coupled with
further development of ecosystem service and

scenario tools. Leading-edge tools are available
for identifying, mapping, and valuing carbon
sequestration, biodiversity, flood protection, etc.
Maps of ecosystem services can include:
Provisioning maps to show where
ecosystem services and goods are
produced;
Beneficiary maps to show who is benefiting from existing ecosystem services;
Flood source maps to show how flooding
is created, and where provisioning of flood
protection and other ecosystem services is
being impaired, such as a bridge that might
restrict the floodway, causing increased
flooding upstream, or a steep and unstable
slope that could slide to block river flows;
Critical path maps to show how the ecosystem services are transferred to beneficiaries and to identify critical areas for service provisioning.
Develop scenario analyses. Create scenario analyses with modeling to help judge project and investment proposals against established criteria.
Develop project prioritization and reporting methodology. Investigate robust reporting options to keep stakeholders and the community informed of project and investment status, location, and performance.
Develop funding mechanisms. Examine improved cross-disciplinary funding mechanisms for storm protection and other ecosystem services to ensure the sustainability of ecosystem project investments and outcomes.
![]()
Develop innovative funding sources. Create

complementary funding sources. Conservation in Intag has generally been funded by the government through local taxes and fees or from grant funding from abroad. There are other funding mechanisms, such as a watershed investment district, agroforestry, and payment for ecosystem service schemes, which could provide complementary funding mechanisms to supplement these traditional approaches.
Seek cross-jurisdictional partnerships. Develop funding mechanisms with a wide combination of complementary international, national, provincial, and local funding mechanisms.
Improve Comprehensive Planning. Continue to advance land use planning, such as watershed characterization, and examine ecosystem services within the watershed, in light of economic development planning. This analysis supports a triple-bottom-line approach.
Invest in Local Research. The range of 18 identified categories of ecological goods and services provided by Intag should be more closely examined. This can be done in a collaborative arrangement with government agencies, organizations, and universities to conduct a set
of ecosystem service studies. For example, if each protected area jurisdiction conducted one ecosystem service study with a full research agenda in its jurisdiction, the compilation of those studied would contribute greatly to better defining and narrowing the range of value
produced by Ecuador's ecosystems. This approach would reduce the cost of the studies and all jurisdictions would benefit.
Progressive Mine Remediation
With Chinese investment in Ecuador copper
extraction, the Junin mine is currently under
consideration for development. If large open-pit
mining does proceed in the Intag region, here are a
few recommendations:
Incorporate the knowledge gained in this information transfer by employing ecosystem services valuations to identify the true impacts to natural systems in order to make a fully informed decision about the project. This will allow for better understanding not only of the direct impacts of the project, but how the health of these systems will be impacted by indirect, long- term influences, and who will reap benefits and who will pay costs.
Provide space for the adoption of precautionary steps as a guiding precept to recognize potential negative impacts and development of a crisis response.
Have transparency in every step of the process and establish accountability mechanisms to ensure compliance with project agreements.
It is through the past 12 years of experience in applying ecosystem service concepts that Earth Economics understands that the impact
Intag community groups can have should not be underestimated. The public should continue to be actively involved and informed of Intag's ecosystem services and their value. Stakeholders should partner with other national and international organizations and governmental agencies to increase their understanding of Intag's natural capital and its
value to local and global communities, and apply sustainability concepts for a prosperous 21,. century Ecuadorian economy.
C&"%'-3)&"
This study shows that the economy and quality of life of the people of Intag and all citizens of Ecuador depend upon healthy "natural capital." This report is the most comprehensive valuation of Intag's natural systems to date. An initial analysis in a growing field, this study should not be taken as the final word
on ecosystem service valuation for Intag, nor a full ecological economic analysis. It is a first step towards understanding the significant economic and social
risks of investment in mining operations in Intag, while accounting for the significant economic contributions that ecosystems make to the regional and national economies.
These natural assets are not indestructible. They can be lost and, in fact, are being lost. The best way to prevent this loss is to invest in economic activities that provide long-term economic and environmental sustainability. The cost to promote conservation
is minimal compared to the income generated by extractive activities and it is also minimal compared to the associated risks.
The ecosystem services examined in this report include climate stability, flood protection, drinking water purification and supply, wildlife habitat, pollination, soil erosion control, soil formation, biological control, nutrient cycling, raw materials, waste treatment, food production, aesthetic, and recreational value. The seven land cover types are: cloud forests, agricultural lands, pastures, mix of agricultural and pastures, rivers and lakes, native Andean alpine grasslands (paramo in Spanish), pre- montane forest, and native bamboo.
In our research, we found that 17 of 23 ecosystem services across the land cover types in Intag provide the regional and national community an average
of $447 million in yearly benefits. These figures are based on cutting-edge economic analysis tools that were developed, in part, with a United States National
Science Foundation grant.
One way of determining economic value is to estimate
the asset value of the natural capital providing this
annual flow of value. This is like comparing house
payments (flow of value) to the market value of the
house (asset value). The value of an asset can be
estimated from the flow of benefits it provides. If the
natural capital of the Intag region were treated like an
economic asset, the asset value of the natural systems
would be an average of $45 billion at a 0-percent
discount rate, which recognizes the renewable nature
of ecosystem services and that there will be people in
the future benefiting from them.
It is becoming increasingly clear that economic sustainability relies on environmental sustainability. The loss of nature's bounty has real regional and global economic costs. The analysis of economic benefits of natural systems has advanced very rapidly with the realization that natural systems are vital to the health and development of economies. Economics is re-tooling for the 21,. century with three essential goals: sustainability, justice, and economic progress. Sustainability requires living at a scale that does not destroy the basic natural systems, which maintain
the economy. Justice and rights are core democratic values. Rights frame and help define economic value. Economic progress provides a global approach to sustainable economic growth, alleviates poverty, and achieves social progress.
The value of the economic benefits the Intag region provides is enormous; indeed, it is priceless. The benefits provided are local, national and global. The economic value of the watershed is larger than its built economic assets or the underground minerals. This conclusion may be surprising given the price of copper in today's market, however, as this report illuminates, the social and environmental costs of copper extraction are much higher than the value of copper itself.
74
In Intag and elsewhere, economic progress depends on healthy communities, healthy people, and sustainable ecosystems. Development progress must be resilient to price fluctuations in single commodities and extend beyond the life of traditional extractive industries. Strategic investment in conservation
and market development for the rich diversity of ecosystem goods and services is key to the long-term viability of this special region of Ecuador.
Ecuadorian leadership has critical investment decisions to make. The term "investment" describes the choices we make today to place resources for returns in the future. An economy is the product of previous decades of investment. Future generations will benefit or suffer from the choices made today. This report provides several recommendations for stabilizing and promoting the social and economic conditions in Intag, which include the following:
Include ecosystem service valuations (ESV) to environmental impact assessments (EIA).
Initiate mapping and modeling of ecosystem services in the region.
Use ESV data to fund further region specific service value transfer studies through local universities and implement broad changes in asset accounting practices.
Perform an initial analysis of restoration and conservation funding mechanism and work with local and regional stakeholders to further refine the sustainable plan to ensure ongoing funding and policy support for basin-scale restoration and conservation efforts.
The overall conclusion of the report is that economic development within the Intag region is best achieved by tapping the vast value that ecosystem goods and services provide and that this approach is aligned
with the development vision of Intag communities. Copper development will carry great costs. It is a risky venture dependent upon global economic trends and pricing, and competition from well established and planned mines that could undercut expected profits and tax revenues. In addition, mining is inherently unsustainable. One day a large pile of mine tailings will be left and the mine closed. World Bank studies confirm that most often the benefits of mining accrue to few while the costs are borne by many, and that, overall, extractive industry dependence is associated with economic decline.
The Intag region is blessed with a flow of benefits on the order of $447 million per year. This is sufficient to build a robust economy given advancement in agroecology, markets, and the development of local
to international funding mechanisms. Well managed, the resources of the Intag region can provide for sustainable, equitable and prosperous development in the region and nation.

75
PHOTO CREDITS
COVER
© KEVIN SCHAFER
PAGE 6
© CARLOS ZORRILLA
PAGE 8
© CARLOS ZORRILLA
PAGE 13
© DECOIN
PAGE 24
© ISTOCKPHOTO I STEVE BAXTER
PAGE 28
© JONATHAN ZANDER
PAGE 30
© CHANCE AGRELLA
PAGE 36
©ISTOCKPHOTOIANGELAARENAL
PAGE 39
© CARLOS ZORRILLA
PAGE 40
© ECUADOR LIVING
PAGE 41
© ECUADOR LIVING
PAGE 42
© WIKICOMMONS
PAGE 43
© ECUADOR LIVING & © CARLOS ZORRILLA
PAGE 44
© CARLOS ZORRILLA
PAGE 45
© CARLOS ZORRILLA
PAGE 46
© EVERYSTOCKPHOTO I LONGHORNDAVE
PAGE 47
© PHOTOXPRESS
PAGE 48
© ANDEAN BEAR FOUNDATION
PAGE 49
© ECUADOR LIVING
PAGE 51
© ECUADOR LIVING & EARTH ECONOMICS
PAGE 52
© SHUTTERSTOCK I MORLEY READ
PAGE 53
© EARTH ECONOMICS
PAGE 54
© MURRAY COOPER
PAGE 55
© WIKICOMMONS
PAGE 56
© CARLOS ZORRILLA
PAGE 57
© MARTIN PADBURY
PAGE 58
© ISTOCKPHOTO
PAGE 68
© FLICKR I SARA Y TZUNKY
PAGE 73
© CARLOS ZORRILLA
PAGE 75
© CARLOS ZORRILLA
!<<6".)@ !7 +,-./ M);),*,)&"3
The results of this first attempt to assign monetary value to the ecosystem services rendered by the Intag region have important and significant implications for the restoration and management of natural capital in the watershed. Valuation exercises have limitations that must be noted, although these limitations should not detract from the core finding that ecosystems produce significant economic value for society. Benefit transfer
analysis estimates the economic value of a given ecosystem (e.g., wetlands) from prior studies of that ecosystem type. Like any economic analysis, this methodology has strengths and weaknesses. Some arguments against benefit transfer include:
Every ecosystem is unique; per-hectare values derived from another location may be irrelevant to the ecosystems being studied.
Even within a single ecosystem, the value per hectare depends on the size of the ecosystem; in most cases, as the size decreases, the per-hectare value is expected to increase and vice versa. (In technical terms, the marginal cost per hectare is generally expected to increase as the quantity supplied decreases; a single average value is not the same as a range of marginal values).
Gathering all the information required to estimate the specific value for every ecosystem within the study area is not feasible. Therefore, the "true" value of all of the wetlands, forests, pastureland, etc. in a large geographic area cannot be ascertained. In technical terms, we have far too few data points to construct a realistic demand curve or estimate a demand function.
To value all, or a large proportion, of the ecosystems in a large geographic area is questionable in terms of the standard definition of exchange value; we cannot conceive of a transaction in which all or most of a large area's ecosystems would be bought and sold. This emphasizes the point that the value estimates for large areas (as opposed to the unit values per hectare) are more comparable to national income accounts aggregates and not exchange values.129 These aggregates (i.e. GDP) routinely impute values to public goods for which no conceivable market transaction is possible. The value of ecosystem services of large geographic areas is comparable to these kinds of aggregates (see below).
Proponents of the above arguments recommend an alternative valuation methodology that amounts to limiting valuation to a single ecosystem in a single location and only using data developed expressly for the unique ecosystem being studied, with no attempt to extrapolate from other ecosystems in other locations. An area with the size and landscape complexity of the Intag region will make this approach to valuation extremely difficult and costly. Responses to the above critiques can be summarized as follows:
While each wetland, forest or other ecosystem is unique in some way, ecosystems of a given type, by their definition, have many things in common. The use of average values in ecosystem valuation is no more and no less justified than their use in other "macroeconomic" contexts, for instance, developing economic statistics such as Gross Domestic or Gross State Product. This study's estimate of the aggregate value of Intag's ecosystem services is a valid and extremely useful (albeit imperfect, as are all aggregated economic measures) basis for assessing and comparing these services with conventional economic goods and services.
As employed here, the prior studies we analyzed encompass a wide variety of time periods, geographic areas, investigators and analytic methods. Many of them provide a range of estimated values rather than single point estimates. The present study preserves this variance; no studies were removed from
the database because their estimated values were deemed to be too high or too low. Limited sensitivity analyses were performed. The approach is similar to determining an asking price for a piece of land based on the prices for comparable parcels. Even though the property being sold is unique, realtors and lenders feel justified in following this procedure to the extent of publicizing a single asking price rather than a price range.
The objection to the absence of even an imaginary exchange transaction was made in response to the study by Costanza et al. (1997) of the value of all of the world's ecosystems. Leaving that debate aside, one can conceive of an exchange transaction in which, for example, all or a large portion of a watershed was sold for development so that the basic technical requirement, that economic values reflect exchange values, could
in principle be satisfied. Even this is not necessary if one recognizes the different purpose of valuation at this scale-a purpose more analogous to national income accounting than to estimating exchange values.129
In this report, we displayed our study results in a way that allows one to appreciate the range of values and their distribution. It is clear from inspection of the tables that the final estimates are not extremely precise. However, they are much better estimates than the alternatives of assuming that ecosystem services have zero value, or, instead, of assuming they have infinite value. Pragmatically, in estimating the value of ecosystem services, it seems better to be approximately right than precisely wrong.
The estimated value of the world's ecosystems presented in Costanza et al. (1997), for example, has been criticized as both (1) a serious underestimate of infinity and (2) impossibly exceeding the entire Gross World Product. These objections seem to be difficult to reconcile, but that may not be so. Just as a human life is "priceless" so are ecosystems, yet people are paid for the work they do.
dynamics, though new dynamic models are being developed. The effect of this omission on valuations is
difficult to assess.
sources of ecosystem services become more limited. The values of many ecological services rapidly increase
as they become increasingly scarce.130 If Intag's ecosystem services are scarcer than assumed here, their
value has been underestimated in this study. Such reductions in supply appear likely as land conversion
and development proceeds. Climate change may also adversely affect the ecosystems, although the precise
impacts are more difficult to predict.
is well known that people value the existence of certain ecosystems, even if they never plan to use or benefit
from them in any direct way. Estimates of existence value are rare; including this service will obviously
increase the total values.
Techniques called multi-criteria decision analyses are available to formally incorporate economic values with
other social and policy concerns. Having economic information on ecosystem services usually helps this
process because traditionally, only opportunity costs of foregoing development or exploitation are counted
against non-quantified environmental concerns.
cover types based, in some cases, on their contextual surroundings, one of the most important issues with
GIS quality assurance is the reliability, both in terms of categorical precision and accuracy, of the land cover
maps used in the benefits transfer. The source GIS layers are assumed to be accurate but may contain some
minor inaccuracies due to changes in land use since the data was sourced, inaccurate satellite readings and other factors.
i.e. that every hectare of forest produces the same ecosystem services. This is clearly not the case. Whether
this would increase or decrease valuations depends on the spatial patterns and services involved. Solving
this requires spatial dynamic analysis. More elaborate systems dynamics studies of ecosystem services have
shown that including interdependencies and dynamics leads to significantly higher values , as changes in
ecosystem service levels ripple throughout the economy.130 Earth Economics has tools to do spatial and
temporal analysis but this kind of work was not included in this study due to funding limitations.
issue since it results in a significant underestimate of the value of ecosystem services. More complete
coverage would almost certainly increase the values shown in this report, since no known valuation studies
have reported estimated values of zero or less. Table 10 illustrates which ecosystem services were identified
in Intag for each land cover type, and which of those were valued.
The use of a range partially mitigates this problem.
cannot provide estimates of consumer surplus. However, this means that valuations based on averages are
more likely to underestimate total value.
are limited by people's perceptions and knowledge base. Improving people's knowledge base about the
contributions of ecosystem services to their welfare would almost certainly increase the values based on
willingness-to-pay, as people would realize that ecosystems provide more services than they had previously
known.
the analysis. These prices do not reflect environmental externalities and are therefore again likely to be
underestimates of true values.
quantity with no thresholds or discontinuities. Assuming (as seems likely) that such gaps or jumps in the
demand curve would move demand to higher levels than a smooth curve, the presence of thresholds or
discontinuities would likely produce higher values for affected services.131
to sustainable levels would imply higher values for ecosystem services as the effective supply of such services
is reduced.
If the above problems and limitations were addressed, the result would most likely be a narrower range of values and significantly higher values overall. At this point, however, it is impractical to determine precisely how much higher the low and high values would be.
!<<6".)@ B7 D6/ $%&'&()%*'
$%&"&;)%3 C&"%6<,3
Human well-being and advancement has always been tied to a healthy supply of nature's goods and services, but early economics models were created in a time of abundant natural resources. In that context, only built, financial and human capital (labor) were identified as constraining factors in the production process. Today's context is very different: Our planet has become "full" of built capital, and natural capital is now the scarce, limiting factor in production. Ecological economics extends basic economics concepts and reflects today's
economy more accurately. The "ecosystem services" framework is an operational way of including natural capital in economics analysis and is important to understanding and embracing an integrated approach to managing a watershed economy.
Economies have existed since humans began to make and distribute goods and services; they have been
instrumental in raising our standard of living and comfort. In the late 18th century, Adam Smith, David Ricardo
and other economists articulated many of the basic market concepts that guide economic policy today. When
Smith and Ricardo lived, the population of the Earth was less than one billion people, the Industrial Revolution
was just beginning, the science of ecology did not exist, and natural goods and services were plentiful relative to
manufactured and built capital.119 Thus, the economy focused on improving quality of life through built capital,
allocating plentiful natural resources to build and distribute these built goods.
Early Economics and the Three Economic Questions
Economics is the study of the allocation of limited, or scarce, resources among alternative desirable ends. This
definition can be stated as three questions, in the following order:
What ends do we desire?
What scarce resources do we need to attain these desirable ends?
What desirable ends receive priority, and to what extent do we allocate resources to them?
Economists have traditionally answered "utility" or "human welfare" to the first question. Human welfare was thought to depend on what people wanted, revealed through market transactions, i.e. goods and services they bought and sold on a market. Classical economics assumed that most scarce resources were market goods, giving the highest attention to one mechanism for allocating alternative resources to alternative ends: the market. This classic thought was also focused on equal allocation of final goods and services (i.e. distribution), and not at all on the problem of an economy's size relative to the natural systems in which it existed (i.e. scale).
Macroeconomic activity is tracked using national economic measures such as the Gross Domestic Product (GDP). GDP adds together both final goods and services (coffee, bus transportation, etc.) and "bads" (e.g. oil spill cleanup costs) to arrive at an indication of the economy's total throughput. Today, GDP is often mistakenly
used to measure economic progress on the assumption that the market is thought to supply most of our desired ends (or more specifically, preferences that we reveal for market goods and services). The GDP is a measurement of market transactions; the rate of GDP growth measures the increase in these transactions. The GDP does not measure quality of life or "economic welfare"-in other words, people's quality of life-and was not intended to do so.
Many of today's economic models and norms were developed when natural capital (such as forests and fish) was abundant, and built capital (such as roads and factories) was scarce. Because economic logic tells us that
we should maximize the productivity of the scarcest, most constraining factors, as well as to try to increase their supply, our economy, facilitated by the instrument of finance, has focused on the production of built capital. This focus on built capital has yielded a highly productive market system for manufactured goods. Capital (such as machinery), land and labor have traditionally been considered the primary "factors of production," and the most constraining to economic development. Natural, social (such as culture) and human capital (such as education), on the other hand, has infrequently been included in economic analysis.
Figure A provides a sketch of the "Partial Economy" model, which includes the traditional "factors of production" and the GDP measure.
Figure A - The Partial Economy Model
Labor
Built
Financial Capital
Investment
Production Process
GDP
4"2<,@2<0/
Goods & Services Consumption
Individual Utility
Capital
Land

Over the past 50 years, humans have changed ecosystems more rapidly and extensively than in any comparable
period in human history, and there is ample evidence that scarcity has shifted from built capital to natural
capital.*() For example, the ability to produce logging machinery, for instance, now far outweighs the world's
forest's ability to grow trees, and timber harvest must be limited by laws and agreements.
Equally, in contrast to several generations prior, timber harvest is now limited by land availability and tree growth, rather than available logging equipment. On a global scale, many experts can now show that humans may be depleting the Earth's flow of natural goods and services faster than the flow can be regenerated, and in many areas we are depleting the natural capital that produces this flow. For example, it has been estimated that humans now directly or indirectly appropriate up to 40 percent of the Earth's annual net primary productivity, dramatically reducing the amount available for other species, including those that support humans (for example, via fisheries).*(* *(( Net Primary Productivity is the total biomass that is produced by ecosystems through photosynthesis, and is the foundation for life on Earth. Other measures present a similar picture: The World Wildlife Fund (WWF) recently calculated the "Ecological Footprint" of humanity, or the land and sea area that would be needed to sustainably regenerate the resources (and absorb the waste) that humans consume annually. It was found that our current rate of resource consumption and waste disposal requires 1.3 planet Earths-and this "footprint" is rising.
Independent of the measure, it appears that our economy today occupies a significant portion of the biosphere. An important reason for this shift in scarcity is that in the past century alone, the per-capita economic production of market goods and services has increased nine-fold.123 Figures B and C illustrate the human economy's move from the "Empty World" situation of the past to the "Full World" situation that we live in today.
The success of the industrial revolution has greatly reduced the scarcity of market goods for much of the world's
population. However, this has entailed a tradeoff: Today, natural goods and services have become scarce.
The shift in scarcity, from built capital to natural capital, holds major implications for the way our economy is
structured and understood. Recognizing why this shift, on a global scale, has not been noticed can be instructive
as we attempt to rebalance natural and built capital, and in addition, human, social and financial capital. Two
major reasons are offered as to why the shift in scarcity has been overlooked, though other reasons certainly
exist:
United Nations states that it took about 123 years (1804-1927) for the Earth's population to grow from 1 to 2 billion, and just 47 years (1927-1975) to then grow from 2 to 4 billion. Not only have human populations grown exponentially, but so has each individual's absolute use of resources. The shift from an "empty world" to a "full world", and a concomitant shift in scarcity, has occurred more quickly than early economic models have been able to adapt.
If natural capital is thought of as a complement to built capital in the creation of goods and services, as it always must be to varying degrees, then its scarcity constrains the other capitals by definition. For example, dams and levees can provide flood protection services, but only after the majority of floodwater mitigation has occurred in headwater forests, wetlands and floodplains. Some natural goods and services, such as oxygen production and carbon sequestration, can be thought of as complements to all types of built capital, because there is no practical built substitute (i.e. all built capital production would cease in the absence of oxygen). In the economy, natural capital is thus, in many respects, an essential complement to built capital.
The primary goal of ecological economics is to ground economic thinking in the physical reality of today's "full
world," a necessary advancement of economic thought. Ecological economics accepts much of the traditional
economic theory regarding efficient allocation, but differs in fundamental respects, for example by addressing
the problem of scale (i.e. sustainability) directly. Specifically examining the relationship between ecosystems,
the economy, and human well-being, ecological economics recognizes that as a subset of nature, our economy is
best understood in the context of natural systems and processes.53
Ecological economics is recognized worldwide as a tool used to improve decision-making processes at all levels of government. The ecological economic model of the economy, or "Whole Economy" model, illustrated in Figure D, demonstrates that production of goods and services is tied to five capitals: natural, built, human, social and financial. Ecosystem goods and services contribute to human well-being, both directly and by providing natural capital for the production process; the negative feedback loops from pollution and degradation are also included. In addition, Figure D introduces the four guiding principles for a healthy economy: good governance, sustainability, efficiency and justice, which are displayed in blue.
In 2001, an international coalition of scientists from the United Nations Environmental Program initiated an
assessment of the effects of ecosystem change on human well-being. The product of this collaboration was
called the Millennium Ecosystem Assessment, which classifies ecosystem services (discussed below) into four
broad categories describing their ecological role.
Ecological Economics and the Three Economic Questions
Earlier in this Appendix three core questions of economics were posed, namely:
What ends do we desire?
What scarce resources do we need to attain these desirable ends?
What desirable ends receive priority, and to what extent do we allocate resources to them?
In light of the whole economy model, ecological economics approaches the three economic questions with logic: It reflects deeply on the first two questions before attempting to answer the third question. The solutions that ecological economics has developed are outlined below.
In the context of ecological economics and the Whole Economy Model, human well-being and a high
quality of life for the current and future generations represent our desired ends. Human well-being is not a
rigidly defined state, but a combination of physical and abstract human ends and needs that differ between
individuals and places . Many of these ends can be met on the market, but many cannot. For example, some
basic shared needs may include a dependable supply of food and clean drinking water, physical and financial
security, health and friendship, and social bonds. Meeting the suite of human needs, now and into the future, largely depends on understanding the extent of our scarce resources and how they are allocated to different ends.
The five capitals represent our scarce resources-the resources that ultimately go towards human needs and
human well-being. The Whole Economy model recognizes that five capitals are essential to economic progress
and a high quality of life: Healthy natural capital underlies all built, human, social and financial capital, which in
turn create the conditions for a healthy and sustainable economy:
Natural Capital. The stock of minerals, energy, plants, animals, and ecosystems found on earth that yields a flow of natural goods and services. When taken as one whole system, natural capital provides the total biophysical context for the human economy.
Human Capital. The self-esteem, knowledge acquired through education, technical skills, and interpersonal skills, such as communication, listening, cooperation, and individual motivation to be productive and socially responsible.
Social Capital. The inventory of organizations, institutions, laws, informal social networks, and relationships of trust that make up or provide for the productive organization of the economy.
Built Capital. The infrastructure of technologies, machines, tools, and transport that humans design, build, and use for productive purposes. Coupled with our learned skills and capabilities, our built techno-
infrastructure is what directly allows raw materials (i.e. natural capital) to be converted into a flow of economic goods and services, the products that we typically find in markets.
Financial Capital. Shares, bonds, banknotes, and other financial assets play an important role in our economy, enabling the other combinations of capital (e.g. healthcare, education) to be owned, traded, and allocated. Financial capital is based on trust and represents a promise that it will eventually be honored with one of the other types of "real" capital.
Attaining Desired Ends: The Four Guiding Principles
The third question of economics is the least straightforward, namely: What ends get priority, and to what extent
do we allocate resources to them? While the question cannot be answered directly, ecological economics
provides four guiding principles that address the long-term attainment of human well-being.
Sustainability. Living within a physical scale that does not destroy the basic natural systems that maintain the economy. Natural systems are part of our "commonwealth," which can be managed sustainably to produce economic benefit to current and future generations.
Justice. Fair distribution of public and private gains from natural, built, human, social, and financial goods and services ensures maximum benefit for lowest public investment. Intergenerational distribution is equally important; our children, grandchildren, and future generations should be given fair access to the Earth's stock of mineral and ecological resources.
Efficiency. Careful decision-making regarding how and where resources are moved or invested to produce different suites of goods and services. Consideration of the most efficient balance of built, natural, human, social and financial capital for the types of goods and services we wish to enjoy, and whether or not a particular balance is detrimental to the goal of long-term sustainability.
Good Governance. This principle consists of two elements:
Creation and maintenance of both private and public institutions and groups, policy instruments,
systems, and markets that ensure sustainability, justice, and efficiency are achieved.
Employing measurements that give an accurate indication of the Whole Economy's health,
measuring what our scarce resources are and whether alternative desired ends are being met.
Addressing Inherent Complexity
Importantly, ecological economics is equipped to deal with complexity, which is a physical reality in our economy.
Ecological economics recognizes that each of the five capitals-natural, built, human, social and financial-
are comprised of complex systems that are closely intertwined. Complex systems are characterized by strong
(usually non-linear) interactions between the parts, complex feedback loops that make it difficult to distinguish
cause from effect, and significant time and space lags, discontinuities, thresholds, and limits.124
The concept of economic or ecological resilience is important. Resilience implies the potential of a system to, after disturbance, return to a previous state. A system is assumed to be fragile when resilience is low. Fragile systems tend to be replaced when disturbed; for example, wetlands that are converted to open water produce reduced amounts of ecosystem services and provide less economic value.125 An entire economic system can also collapse without resilience and revert to a less productive one (Somalia, or in many countries' agricultural areas subject to desertification); ecological economics therefore strives to build resilience into economic understanding.
One advantage of the Whole Economy Model is that it can account for the full range of economically valuable
benefits that natural capital provides beyond resource extraction, such as carbon sequestration and water filtration. Ecological economics, guided by the Whole Economy Model, has developed an operational framework through which to accurately internalize the value of nature in economic decision-making, the "ecosystem service" framework. Ecosystem services were recently given higher prominence in the Millennium Ecosystem Assessment, a project called for in 2000 by then-United Nations Secretary-General Kofi Annan, which was completed in 2005.
The Millennium Ecosystem Assessment set out to examine the worldwide changes in ecosystems that have been occurring, the impacts of these changes on human well-being, and options for enhancing the conservation of ecosystems and their contribution to human well-being. The project, involving over 1,360 experts worldwide
and a multi-stakeholder board representing governments, businesses, NGOs, indigenous peoples and international institutions, utilized the concept of "ecosystem services" to best understand the linkages between ecosystems and human well-being. In 2000, The Fund for the Protection of Water (FONAG) was established by the Ecuadorian municipal government, together with local NGOs, to act as a trust fund which uses proceeds contributed by major cities, like Quito, to finance critical ecosystem services. Through the fund, nearly 65,000 hectares of watersheds are now under improved management, by which upstream farmers receive support for watershed protection programs.126
Our natural environment provides many of the things we need to survive: breathable air, drinkable water, food for nourishment, and stable atmospheric conditions, to name a few. These are what we refer to as "ecosystem goods and services." Ecosystem goods and services are those derived from natural systems that provide benefit to humans. Ecosystems perform many functions, but only functions that provide human benefits are considered ecosystem goods or services. Every ecosystem produces a "suite" of ecosystem services.
Healthy, resilient, natural infrastructure, referred to as "natural capital", is critical to the production of ecosystem goods and services. The natural capital of an ecosystem consists of its individual structural components (trees, forests, soil, hill slopes, etc.) that produce dynamic processes (water flows, nutrient cycling, animal life cycles, etc.), which, in turn, create functions (water catchment, soil accumulation, habitat creation, etc.) that generate ecological goods and services (coffee, timber, flood protection, recreation, etc.). This relationship is summarized in Figure E, and might be likened to the production of cars in a factory: To build a car (a "built" good) requires high quality built capital (e.g. the factory, machines, and connection to a power plant), natural capital (e.g. the extracted metal, rubber, food for the workers), human capital (the workers), financial capital (equity to buy the raw materials) and social capital (labor laws and agreements, etc.).
Ecosystem goods and services are different from the economic benefits provided by labor and capital that we typically value in the economy. Although we might include the dollar value of a levee as an economic asset, as measured by the costs of the workers' time, fuel, and earthmoving equipment, if we do not include the value
of flood protection provided by forests, wetlands, and lakes, then the economic analysis is deeply flawed. These "natural" assets sometimes provide more flood protection than built structures and can often be implemented with little or no capital cost (the cost of building a levee or building), and low maintenance costs (the cost of upkeep).
Ecosystem services clearly provide economic value to our measured economy. When the values of ecosystem services are not counted, their loss is often felt economically. Ecological economics provides the framework to include the real value of these goods and services in economic accounting and decision-making. When we alter environmental conditions, critical ecosystem services are damaged or lost, and must then be replaced by more costly built alternatives that are often funded by taxpayers. If ecosystems are valued as assets, however, the most valuable and cost-effective services will not be lost. Otherwise, once lost, many ecosystem goods and services may not be recoverable.

Figure E - The Link between Natural Infrastructure and Ecosystem Goods and Services

Ecosystem Infrastructure & Processses
Ecosystem Functions

Specific Ecosystem Goods & Services
Ecosystem Goods
Ecosystem goods are typically tangible, quantifiable items or flows, such as drinking water, trees for forestry, fish,
and food. Most goods are excludable, which means that if one individual owns or uses a particular good, that
individual can exclude others from owning or using the same good. For example, if one person eats a banana,
another person cannot eat that same banana. Excludable goods can be traded and valued in markets. The
quantity of water produced per second or the amount of timber cut in a 40-year rotation can be measured by
the physical quantity an ecosystem produces over time. The current production of goods can be valued relatively
easily by multiplying the quantity produced by the current market price.
Ecosystem Services
Ecosystem services are defined as "the conditions and processes through which natural ecosystems, and the
species that make them up, sustain and fulfill human life."127 Unlike ecosystem goods, ecosystem services are
generally not tangible items that one can see or hold. Flood protection, recreational value, aesthetic value, and
storm prevention are a few of the services that ecosystems may provide. Though often more difficult to value
because market values rarely exist, ecosystems services have tremendous economic value and are critical both
for our quality of life and for economic production.127 128 There are now economic techniques for valuing many
ecosystem services.
One reason these services have not been monetized is that many ecosystem services are non-excludable. For example, when one person enjoys a view of a sunset, or Cuicocha Lake, another person is not prevented from enjoying the same view. Similarly, many non-paying downstream residents may benefit from the flood protection provided by forested land upstream. Because of the challenge associated with valuing and measuring ecosystem services, they have often been ignored. However, in many cases, the value of a service flow may significantly exceed the value of the flow of goods.
For example, a standing forest may be cut down once every few decades to provide an ecosystem good- timber-with revenue generated from the harvest and sales of the wood. However, the same forest, if left standing, might purify the drinking water for a nearby city for centuries, saving the cost of constructing a filtration plant and the additional costs of maintaining the plant each year as it begins to degrade.
The City of Quito offers an example of the benefits received from protecting watersheds that act as the source
of economic demand for water. For the 1.5 million inhabitants of Quito and its surrounding areas, the availability
of water depends on the conservation of protected areas upstream, where more than 60 percent of the water
supply originates from the Cayambe-Coca Reserve.3
!<<6".)@ C7 L*'-6 81*"3061 +,-.)63 E36. F/ M*". C&:61 C'*33
Land Cover | Ecosystem Service General | Author(s) | Minimum | Maximum |
Agricultural Lands | Aesthetic & Recreational | Bergstrom, J., Dillman, B. L. and Stoll, J. R. 1985 | $72.03 | $72.03 |
Erosion Control | Canadian Urban Institute. | $14.16 | $14.16 | |
Gas & Climate Regulation | Smith, W.N. et al. | $68.43 | $68.43 | |
Wilson, Sara J. | $27.70 | $774.00 | ||
Nutrient Cycling | Canadian Urban Institute. | $54.27 | $54.27 | |
Pollination | Robinson, W. S., Nowogrodzki, R. and Morse, R. A. 1989 | $31.69 | $31.69 | |
Southwick, E. E. and Southwick, L. 1992 | $6.29 | $6.29 | ||
Ricketts, T.H., Daily, G.C., Ehrlich, P.R., and Michener, C.D. | $419.41 | $419.41 | ||
Raw Materials | Martinet, A. | $988.65 | $988.65 | |
Valverde, M. and Gaybor, A. | $2,525.28 | $2,525.28 | ||
Soil Formation | Canadian Urban Institute. | $14.16 | $14.16 | |
Sandhu, H.S., Wratten, S.D., Cullen, R., and Case, B. | $14.16 | $14.16 | ||
Food Production | Martinet, A. | $384.47 | $10,512.64 | |
Valverde, M. and Gaybor, A. | $4,681.29 | $4,681.29 | ||
Pasture | Soil Formation | Pimentel, D. 1998 | $16.29 | $16.29 |
Bamboo Pasture and Agricultural | Gas & Climate Regulation | Tianhong, L. et al. | $474.45 | $615.01 |
Habitat Refugium & Nursery | Tianhong, L. et al. | $572.85 | $572.85 | |
Raw Materials | Tianhong, L. et al. | $456.86 | $456.86 | |
Soil Formation | Tianhong, L. et al. | $676.24 | $676.24 | |
Waste Treatment | Tianhong, L. et al. | $230.19 | $230.19 | |
Water Supply Aesthetic & Recreational | Tianhong, L. et al. New Jersey Type A Studies 2006 | $562.14 $63.68 | $562.14 $63.68 | |
Biological Control | Costanza et al. 1997 | $33.51 | $33.51 | |
Pollination | New Jersey Type A Studies 2006 | $5.56 | $28.02 | |
Soil Formation | Costanza et al. 1997 | $1.41 | $1.41 | |
Food Production | Costanza et al. 1997 | $86.26 | $86.26 |
Native Andean Alpine Grasslands | Biological Control | Pimentel et al. 1995 | $22.61 | $22.61 |
Pimentel et al. 1997 | $33.16 | $33.16 | ||
Erosion Control | Barrow (1991) (Calculated 1992) | $44.21 | $44.21 | |
Costanza et al. 1997 | $41.83 | $41.83 | ||
Gas & Climate Regulation | Costanza et al. 1997 | $9.51 | $9.51 | |
Fankhauser and Pearce (1994) | $9.41 | $9.41 | ||
Wilson, Sara J. | $25.82 | $397.35 | ||
Wunder, S., et al. | $148.47 | $296.94 | ||
Habitat Refugium & Nursery | Asquith et al. | $3.10 | $3.10 | |
Pollination | Pimentel et al. 1995 | $25.01 | $25.01 | |
Pimentel et al. 1997 | $36.07 | $36.07 | ||
Soil Formation | Costanza et al. 1997 | $1.44 | $1.44 | |
Sala and Paruelo (1997) (Calculated 1994) | $1.21 | $1.21 | ||
Waste Treatment | Pimentel et al. 1997 | $125.49 | $125.49 | |
Wunder et al. | $7.48 | $14.95 | ||
Water Regulation | Costanza et al. 1997 | $4.32 | $4.32 | |
Jones et al. (1985) (Calculated 1992) | $5.02 | $5.02 | ||
Water Supply | Asquith et al. | $3.10 | $3.10 | |
Wunder, S. et al. | $7.48 | $14.95 | ||
Food Production | US Dept of Comm (1995) (Calculated 1992) | $57.03 | $57.03 | |
Rivers and Lakes | Aesthetic & Recreational | Burt, O. R. and Brewer, D. | $1,209.65 | $1,209.65 |
Cordell, H. K. and Bergstrom, J. C. | $354.58 | $3,718.51 | ||
Kealy, M. J. and Bishop, R. C. | $33.87 | $33.87 | ||
Kreutzwiser, R. | $474.75 | $474.75 | ||
Piper, S. | $629.16 | $629.16 | ||
Ward, F. A., Roach, B. A. and Henderson, J. E. | $53.64 | $5,025.45 | ||
Young, C. E. and Shortle, J. S. | $214.39 | $214.39 | ||
Loomis J.B. 2002 | $29,155.62 | $51,597.93 | ||
Postel & Carpenter 1997 | $230.01 | $230.01 | ||
Habitat Refugium & Nursery | Loomis 1996 | $42.33 | $42.33 | |
Waste Treatment | Gibbons (1986) (Calculated 1980) | $183.92 | $2,391.04 | |
Water Regulation | Gibbons (1986) (Calculated 1980) | $3,697.88 | $6,466.48 | |
Water Supply | Bouwes, N. W. and Scheider, R. | $1,617.32 | $1,617.32 | |
Croke, K., Fabian, R. and Brenniman, G. | $1,482.30 | $1,482.30 | ||
Gibbons (1986) (Calculated 1980) | $163.68 | $1,257.87 | ||
Henry, R., Ley, R. and Welle, P. | $1,124.47 | $1,124.47 | ||
Howe & Easter (1971) (Calculated 1971) | $361.42 | $14,641.83 | ||
Piper, S. | $79.91 | $79.91 | ||
Ribaudo, M. and Epp, D. J. | $2,209.24 | $2,209.24 | ||
Food Production | Postel & Carpenter 1997 | $40.99 | $40.99 |
Cloud Forests | Aesthetic & Recreational | Prince, R. and Ahmed, E. | $3.68 | $4.70 |
Gössling, S. | $9.55 | $766.06 | ||
Biological Control | Costanza et al. 1997 | $5.68 | $5.68 | |
Krieger, D.J. | $23.55 | $23.55 | ||
Erosion Control | Chopra 1993 | $6.82 | $958.89 | |
Costanza et al. 1997 | $136.82 | $136.82 | ||
Chomitz, K.M., and Kumari, K. | $76.02 | $824.93 | ||
Magrath, W.B., and Arens, P. | $9.07 | $9.07 | ||
Gas & Climate Regulation | Pimentel, D. 1998 | $32.94 | $32.94 | |
Adger et al. 1995 | $34.60 | $173.01 | ||
Mates. W., Reyes, J. 2004 | $44.90 | $623.02 | ||
New Jersey Type A Studies 2006 | $26.12 | $32.94 | ||
Kumari, K. | $500.97 | $500.97 | ||
Grieg-Gran, M. et al. | $77.23 | $135.15 | ||
Genetic Resources | Adger et al. 1995 | $1.73 | $155.71 | |
Pearce, D., and Moran, D. | $34.47 | $34.47 | ||
Godoy, R. et al. | $55.05 | $253.84 | ||
Habitat Refugium & Nursery | Amigues, J. P., et. al. | $158.25 | $604.54 | |
Amigues, J. P., et. al. 2002 | $185.72 | $709.56 | ||
Garber et al. 1992 | $706.82 | $1,185.42 | ||
Haener, M. K. and Adamowicz, W. L. | $3.76 | $25.75 | ||
Kenyon, W. and Nevin, C. | $1,310.29 | $1,310.29 | ||
Shafer, E. L. et. al. | $7.36 | $7.36 | ||
New Jersey Type A Studies 2006 | $2.59 | $1,342.82 | ||
Asquith et al. | $3.10 | $3.10 | ||
Nutrient Cycling | Chopra 1993 | $1,346.65 | $1,346.65 | |
Costanza et al. 1997 | $514.55 | $514.55 | ||
Pollination | Wilson, Sara J. | $487.17 | $487.17 | |
New Jersey Type A-C studies 2006 | $145.79 | $654.83 | ||
Asquith et al. | $3.10 | $3.10 | ||
Raw Materials | Costanza et al. 1997 | $35.63 | $35.63 | |
Shone and Caviglia-Harris 2006 | $20.59 | $42.40 | ||
Grimes, A. et al. | $3,423.68 | $3,423.68 | ||
Gram, S. | $11.21 | $21.18 | ||
Soil Formation | Costanza et al. 1997 | $14.26 | $14.26 | |
Pimentel et al. 1997 | $10.01 | $10.01 | ||
Waste Treatment | Pimentel et al. 1997 | $87.01 | $87.01 | |
Adger et al. 1995 | $86.51 | $259.52 | ||
Water Regulation | Loomis, J.B. 1988 | $25.17 | $25.17 | |
Olewiler, N. | $76.65 | $76.65 | ||
Water Supply | Asquith et al. | $3.10 | $3.10 | |
Kumari | $10.58 | $10.58 | ||
Food Production | Costanza et al. 1997 | $71.27 | $71.27 | |
Adger et al. 1995 | $2,659.22 | $2,659.22 | ||
Godoy et. al. 1993 | $8.38 | $110.13 |
!<<6".)@ N7 $%&3/3,6; +61:)%6
L*'-*,)&" +,-.)63
Adger, W.N, Brown, K., Cervigni R., Moran D., 1995. Total economics value of forests in Mexico. Ambio 24(5): 286- 296.
Amigues, J. P., C. Boulatoff, B. Desaigues, C. Gauthier, and J. E. Keith. 2002. The benefits and costs of riparian analysis habitat preservation: a willingness to accept/willingness to pay contingent valuation approach. Ecological Economics 43: 17-31.
Asquith, N.M., Vargas, M.T., Wunder, S., 2008. Selling two environmental services: In-kind payments for bird habitat and watershed protection in Los Negros, Bolivia. Ecological Economics 65, 675-684.
Barrow, C.J. 1991. Land degradation. Cambridge University Press, Cambridge.
Bergstrom, J., B.L. Dillman, and J. R. Stoll. 1985. Public environmental amenity benefits of private land: the case of prime agricultural land. South Journal of Agricultural Economics 7: 139-149.
Bouwes, N. W. and R. Scheider. 1979. Procedures in estimating benefits of water quality change. American Journal of Agricultural Economics 61(3): 635-639.
Burt, O.R. and D. Brewer. 1971. Estimation of net social benefits from outdoor recreation. Econometrica 39: 813-827.
Chomitz, K.M., Kumari, K., 1996. The Domestic Benefits of Tropical Forests: A Critical Review Emphasizing Hydrological Functions. The World Bank, PRDEI 1601.
Chopra, K. 1993. The value of non-timber forest products: An estimation for tropical deciduous forests in India.
Economic Botany 47(3): 251-257.
Cordell, H. K. and J. C. Bergstrom. 1993. Comparison of recreation use values among alternative reservoir water level management scenarios. Water Resources Research 29: 247-258.
Costanza, R., R. dArge, R. deGroot, S. Farber, M. Grasso, B. Hannon, K. Limburg, S. Naeem, R. V. Oneill, J. Paruelo,
R. G. Raskin, P. Sutton, and M. vandenBelt. 1997. The value of the world’s ecosystem services and natural capital. Nature 387: 253-260.
Costanza, R., Wilson M, Troy A, Voinov A, Liu S, J. D’Agostino. 2006.The Value of New Jersey’s Ecosystem Services and Natural Capital.
Croke, K., R. Fabian, and G. Brenniman. 1986. Estimating the value of improved water-quality in an urban river system. Journal of Environmental Systems 16: 13-24.
Fankhauser, S., and D.W. Pearce. 1994. The social costs of greenhouse-gas emissions - an expected value approach.
Energy Journal 15:157-184.
Garber, J.H., J.L. Collins, and M.W. Davis. 1992. Impacts of estuarine benthic algal production on dissolved nutrients and water quality in Yaquina River Estuary, Oregon. Water Resources Research Institute, Report WRRI-112, Oregon State University, Corval
Gibbons, D.C. 1986. The economic value of water. Resources for the Future, Washington D.C.
Godoy, R., Lubowsky, R., Markandaya, A.,1993. A method for the economic valuation of non-timber forest products.
Economic Botany 47(3): 220-233
Gössling, S., 1999. Ecotourism: a means to safeguard biodiversity and ecosystem functions? Ecological Economics 29, 303-320.
Gram, S., 2001. Economic valuation of special forest products: an assessment of methodological shortcomings
Grieg-Gran, M., Porras, I., Wunder, S., 2005. How Can Market Mechanisms for Forest Environment Services Help the
Poor? Preliminary Lessons from Latin America. World Development. Vol. 33. No. 9. Pgs 1511-1527.
Grimes, A., Loomis, S., Jahnige, P., Burnham, M., Onthank, K., Alarcón, R., Palacios, W.C., Cerón, C.M., Neill, D., Balick, M., Bennett, B., Mendelsohn, R., 1994. Valuing the Rain Forest: The Economic Value of Nontimber Forest Products in Ecuador. Ambio 2
Haener, M.K., and Adamowicz, W.L. 2000. Regional forest resource accounting: A northern Alberta case study.
Canadian Journal of Forest Research 30(2): 264-273.
Henry, R., R. Ley, and P. Welle. 1988. The economic value of water resources: the Lake Bemidji survey. Journal of the Minnesota Academy of Science 53: 37-44.
Howe, C.W., and K.W. Easter. 1971. Interbasin transfer of water: Economic issues and impacts. Baltimore: The Johns Hopkins Press.
Jones, O.R., H.V. Eck, S.J. Smith, G.A. Coleman, and V.L. Hauser. 1985. Runoff, soil, and nutrient losses from rangeland and dry-farmed cropland in the southern high plains. Journal of Soil and Water Conservation 1: 161-164.
Kealy, M. J. and R. C. Bishop. 1986. Theoretical and empirical specifications issues in travel cost demand studies.
American Journal of Agricultural Economics 68: 660-667.
Kenyon, W. and C. Nevin. 2001. The use of economic and participatory approaches to assess forest development: a case study in the Ettrick Valley. Forest Policy and Economics 3: 69-80.
Kreutzwiser, R. 1981. The economic significance of the long point marsh, Lake Erie, as a recreational resource. Journal of Great Lakes Resources 7:105-110.
Kumari, K. 1995. An environmental and economic assessment of forest management options: a case study in Malaysia. The World Bank. Environmental Economics Series 013, Washington, D.C.
Loomis, J. B. (1996), Measuring the Economic Benefits of Removing Dams and Restoring the Elwha River: Results of a Contingent Valuation Survey, Water Resour. Res., 32(2), 441–447
Loomis, J. B. 1988. The bioeconomic effects of timber harvesting on recreational and commercial salmon and steelhead fishing: A case study of the Siuslaw National Forest. Marine Pollution Bulletin 5: 43-60.
Loomis, J.B. 2002. Quantifying Recreation Use Values from Removing Dams and Restoring Free-Flowing Rivers: A Contingent Behavior Travel Cost Demand Model for the Lower Snake River. Water Resources Research 38 (6)
Magrath, W.B., Arens, P., 1989. The Costs of Soil Erosion on Java: A Natural Resource Accounting Approach. The World Bank, ENV 0018.
Martinet, A., 2006. Diagnostico Agro-Socio-Economico de la microcuenca del rio Cristopamba, Imbabura, Ecuador.
ENSAM, Montpellier (FRA).
Mates. W., Reyes, J. 2004. The economic value of New Jersey state parks and forests. New Jersey Department of Environmental Protection.
Pearce, D., Moran, D., 1994. The Economic Value of Biodiversity. IUCN, Earthscan Publications.
Pimentel, D. 1998. Benefits of biological diversity in the state of Maryland. Ithica, NY: Cornell University, College of Agricultural and Life Sciences.
Pimentel, D., C. Harvey, P. Resosudarmo, K. Sinclair, D. Kurz, M. McNair, S. Crist, P. Sphpritz, L. Fitton, R. Saffouri, R. Blair. 1995. Environmental and Economic Costs of Soil Erosion and Conservation Benefits. Science 267: 1117-1123.
Pimentel, D., C. Wilson, C. McCullum, R. Huang, P. Owen, J. Flack, Q. Trand, T. Saltman, and B. Cliff. 1997.
Environmental and Economic Benefits of Biodiversity.
Piper, S. 1997. Rigonal impacts and benefits of water-based activities: an application in the Black Hills region of South Dakota and Wyoming. Impact Assessment 15: 335-359.
Postel, S., and S. Carpenter. 1997. Freshwater ecosystem services. In Ecosystem services: their nature and value, edited by G. Daily. Washington, D.C.: Island Press.
Prince, R. and E. Ahmed. 1989. Estimating individual recreation benefits under congestion and uncertainty.” Journal of Leisure Research 21: 61-76.
Ribaudo, M. and D.J. Epp. 1984. The importance of sample discrimination in using the travel cost method to estimate the benefits of improved water quality. Land Economics 60: 397-403.
Ricketts, T.H., Daily, G.C., Ehrlich, P.R., and Michener, C.D. 2004. Economic value of tropical forest to coffee production. Proceedings of the National Academy of Sciences 101(34): 12579-12582
Robinson, W.S, R. Nowogrodzki, and R.A. Morse. 1989. The value of honey bees as pollinators of US crops. American Bee Journal 129(7): 477-487.
Sala, O.E. and f. M. Paruelo. 1997. Ecosystem services in grasslands. In Nature’s services: Societal dependence on natural ecosystems, edited by G. C. Daily, 237-252. Washington, D.C.: Island Press.
Sandhu, H.S., Wratten, S.D., Cullen, R., and Case, B. 2008. The future of farming: The value of ecosystem services in conventional and organic arable land. An experimental approach. Ecological Economics 64: 835-848.
Shafer, E. L., R. Carline, R. W. Guldin, and H. K. Cordell. 1993. Economic amenity values of wildlife - 6 case-studies in Pennsylvania. Environmental Management 17: 669-682.
Shone, B.M, and Caviglia-Harris J.L. 2006. Quantifying and comparing the value of non-timber forest products in the Amazon. Ecological Economics 58(2): 249-267.
Smith W.N. et al. 2001. Estimated changes in soil carbon associated with agricultural practices in Canada. Canadian Journal of Soil Science 81: 221-227.
Southwick, E. E. and L. Southwick. 1992. Estimating the economic value of honey-bees (hymenoptera, Apidae) as agricultural pollinators in the United States. Journal of Economic Entomology 85: 621-633.
Thibodeau, F. R., and Ostro, B.D. 1981. An economic analysis of wetland protection. Journal of Environmental Management 12: 19-30.
Tianhong, L., Wenkai, L., Zhenghan, Q., 2010. Variations in ecosystem service value in response to land use changes in Shenzhen. Ecological Economics 69, 1427-1435.
Tyrvainen, L. 2001. Economic valuation of urban forest benefits in Finland. Journal of Environmental Management 62: 75-92.
Valverde, M., Gaybor, A., 2008. Diagnostico Agrario en la cuenca del rio Cachaco Lita, Imbabura. Universidad Central del Ecuador.
Ward, F. A., B. A. Roach, and J. E. Henderson. 1996. The economic value of water in recreation: Evidence from the California drought. Water Resources Research 32: 1075-1081.
Wilson, S.J. 2008. Ontario’s wealth, Canada’s future: Appreciating the value of the Greenbelt’s eco-services.
Wunder, S., Albán, M. 2008. Decentralized payments for environmental services: The cases of Pimampiro and PROFAFOR in Ecuador. Ecological Economics 65, 685-698.
Young, C.E. and J.S. Shortle. 1989. Benefits and costs of agricultural nonpoint-source pollution controls: the case of St. Albans Bay. Journal of Soil and Water Conservation 44(1): 64-67.
!<<6".)@ $7 !3%6".*", C&<<61G563-',3 &0
C96%J !33*/)"( =1&(1*; &" O-")" =1&<61,/
![]()
![]()
![]()

ao ...........
c: • .. .1.11 . . .
E... lt'')ll'lll • lf'r
...-: r zg tll,;o,
,...n&..-: 111
t!'ll•

-MIJ.;
·r-il-l4. IIJ.l
![]()

:E::.iil!IZ2..

$PNPQ8$+
Mittermeier, R.A., Gil, P.R., Hoffman, M., Pilgrim, J., Brooks, T., Mittermeier, C.G., Lamoreux, J., da Fonseca,
G.A.B. 2005. Hotspots Revisited: Earth's Biologically Richest and Most Endangered Terrestrial Ecoregions.
Conservation International.
Intag Cloud Forest Reserve. 2010. Available at: http://www.intagcloudforest.com/ (retrieved January 2011).
Bubb, P., May, I., Miles, L., Sayer, J. 2004. Cloud Forest Agenda. UNEP-WCMC, Cambridge, UK.
Rivas-Martfnez, S., Saanchez-Meta, D., Costa, M. 1999. North American Boreal and Western Temperate Forest Vegetation. Itinera Geobotanica. 12: 5-316.
Markham, A. 1998. Potential impacts of climate change on tropical forests ecosystems (guest editorial). Clim.
Change 39 (2-3): 141-143.
Provincia Esmeralda. Esmeralda. Available at: ND. http://billy-mendez.iespana.es/esmeralda.html (retrieved January 2011).
Samaniego, A., Penaherrera D. 2002. Etnograffa, Linguistica e Historia Antigua de los Caras o Yumbos Colorados (1534-1978). Abya-Yala.
Rivadeneira, J., Robalino L. 2004. Vivir en los Andes occidentales de Cotacachi. Abya-Yala.
JICA/MMAJ. 1998. Informe final sobre la exploracion mineral de cooperacion tecnica en el area de Imbaoeste, Republica del Ecuador.
Bebbington A., Bebbington D. H., Bury J., Lingan J., Munoz J. P. 2008. Mining and Social Movements: Struggles Over Livelihood and Rural Territorial Development in the Andes. World Development 36 (12) 2888- 2905.
Zorrilla C. 2010. Ecuador: Correa Looks to Reopen Unpopular Mining Project in Junin. Available at: http:// upsidedownworld.org/main/ecuador-archives-49/2500--correa-looks-to-reopen-unpopular-mining-project- in-junin (retrieved January 2011).
Zorrilla C. 2008. It's all over for copper Mesa Mining Corporation in INTAG. Available at: http://www.decoin. org/author/admin/page/2/ (retrieved January 2011).
Mychalejko C. 2008. Ascendant Copper Loses Mining Concessions in Ecuador. Available at: http:// upsidedownworld.org/main/ecuador-archives-49/1106-ascendant-copper-loses-mining-concessions-in- ecuador (retrieved November 2010).
Solum T. 2010. Ecuadorian Community Activists get Canadian Mining Company Delisted from TSX. Available at: http://understory.ran.org/2010/01/29/ecuadorian-community-activists-get-canadian-mining-company- delisted-from-tsx/ (retrieved January 2011).
Ciuffardi, T. 2008. Ecuador: Asamblea aprueba Constituci6n. BBC July 25. Available at: http://news.bbc.co.uk/ hi/spanish/latin_america/newsid_7524000/7524720.stm (retrieved February 2011).
Smith, G., 2009. Ecuador Ratifies World's First Constitution to Give Rights to Nature. Available at: http:// native-rights-news.blogspot.com/2009/02/ecuador-ratifies-worlds-first.html (retrieved November 2010).
Kendall, C., 2008. A new law of nature. Available at: http://www.guardian.co.uk/environment/2008/sep/24/ equador.conservation (retrieved November 2010).
Ecuadorian Constitution. Article 71. 2008. Available at: http://www.asambleanacional.gov.ec/documentos/ constitucion_de_bolsillo.pdf (retrieved January 2011).
Echevarria, M., Vogel, J., Alban, M., Meneses, F. 2004. The impacts of payments for watershed services in Ecuador. Emerging lessons from Pimampiro and Cuenca. International Institute for Environment and Development, London.
Dosh P., Kligerman N., 2009. Correa vs. Social Movements: Showdown in Ecuador. NACLA. Available at: https://nacla.org/node/6094 (retrieved February 2011).
Jarrin S. 2011. People's Tribunal against the Criminalization of Protest in Ecuador. Available at: http:// upsidedownworld.org/main/ecuador-archives-49/3099-peoples-tribunal-against-the-criminalization-of- protest-in-ecuador (retrieved January 2011).
Moore, J., 2009. Ecuador: Mining and the Right of Way. Available at: http://upsidedownworld.org/main/ ecuador-archives-49/1777-ecuador-mining-and-the-right-of-way (retrieved August 2010).
U.S. Energy Information Administration. 2010. Available at: http://www.eia.doe.gov/countries/cab. cfm?fips=EC (retrieved January 2011).
Moore, J. 2007. ALAI: America Latina en Movimiento. Available at: http://www.alainet.org--see and http:// www.minesandcommunities.org/article.php?a=2059 (retrieved January 2011).
Weber-Fahr M., Strongman J., Kunanayagam R., McMahon G. and Shelton C. 2001. Mining and poverty reduction. Washington, DC: The World Bank.
Pegg, Scott. 2006.Mining and Poverty Reduction: Transforming Rhetoric into Reality. Journal of Cleaner Production. 14: 376-387.
Oyarzun, R., Lillo, J., Oyarzun, J., Maturana, H., Canut, C., Andreani, S. 2010. Restrictive definition of asbestos and the assessment of potential health hazards: insights from Northern Chile. International Geology Review, 52: 9, 955-963.
Cederstav, A.K., Barandiaran, G. 2002. La Oroya Cannot Wait. Interamerican Association for Environmental Defense, Peruvian Society for Environmental Law.
Septoff, A. 2005. Fact Sheet Hardrock Mining: Acid Mine Drainage. EARTHWORKS. http://www. earthworksaction.org/pubs//FS_AMD.pdf (retrieved June 2011).
Pandey, P.K., Sharma, R., Roy, M. and Pandey, M. 2007. Toxic Mine Drainage from Asia's Biggest Copper Mine at Malanjkhand, India. Environ Geochem Health. 29: 237-248.
U.S. Environmental Protection Agency. 2011. Radiation Protection. Available at: http://www.epa.gov/ rpdweb00/tenorm/copper.html#leaching (retrieved July 2011)
Essumang, D.K. 2009. Analysis and Human Health Risk Assessment of Arsenic, Cadmium, and Mercury in Manta Birostris (Manta Ray) Caught Along the Ghanaian Coastline. Human And Ecological Risk Assessment, 15: 985-998.
David, C. 2002. Heavy metal concentrations in marine sediments impacted by a mine-tailings spill, Marinduque Island, Philippines. Environmental Geology. 42: 955-965.
Reuters, 2010. Available at: http://in.reuters.com/article/2010/10/09/idINIndia-52073720101009 (retrieved January 2011).
Distribucion y Consumo Energetico en Chile. INE Available at : http://www.ine.cl/canales/menu/boletines/ enfoques/2008/septiembre/energia_pag.pdf (retrieved January 2011).
United Press International. 2009. Ecuador energy crisis cripples production, disrupts cities. http://www.upi. com/Business_News/Energy-Resources/2009/11/17/Ecuador-energy-crisis-cripples-production-disrupts- cities/UPI-91091258489130/ (retrieved January 2011).
Ross, M.L. 2001. Does oil hinder democracy? World Politics 53(3):325e61.
Mutumweno, N. 2010. Zambia's Mining Resurgence. Available at: http://www.businesstimesafrica.net/btm/ details.cfm?prodcatID=6&tblNewsCatID=40&tblNewsID=321 and http://www.ilo.org/public/english/support/ lib/financialcrisis/featurestories/story26.htm (retrieved January 2011).
de Soysa I. The resource curse: are civil wars driven by rapacity or paucity? In: Berdal M, Malone DM, editors.
Greed and grievance: economic agendas in civil wars. Boulder: Lynne Rienner Publishers; 2001. p. 113e35.
NWDT Award, Clause IV(1). Sardar Sarovar Construction Advisory Committee, Hydropower Complex, available at: http://www.sscac.gov.in/m_hydro.html (retrieved January 2010).
Leite, C., Weidmann, J. 2009. Does mother nature corrupt? Natural resources, corruption, and economic growth. International Monetary Fund Working Paper WP/99/85, Washington, DC.
Municipality of Santa Ana de Cotacachi. 2000. Ordinance Declaring Cotacachi An "Ecological County".
Available at: http://www.rainforestinfo.org.au/projects/anja/ordinance.htm (retrieved January 2011).
Martinet, A. 2006. Diagnostico AgroSocioEconomico de la microcuenca del Rio Cristopamba. Imbabura, Ecuador.
PRODECI. 2007. Fundacion A Favor de los Derechos Ciudadanos. Available at: http://www.prodeci.org/ prodeci.org/ (retrieved January 2011).
Conservation International. 2007. Biodiversity Hotspots. Available at: http://www.biodiversityhotspots.org/ xp/hotspots/andes/Pages/default.aspx (retrieved August 2011).
World Peace Garden Project. 2000. Ecuador- A World Center of Natural Biological Diversity. Available at: http://www.losvisionarios.org/A_worldcenter.html (retrieved January 2011).
Hays, J. 2009. Products, Medicines and Perfumes from the Rainforest. Rainforest Action Network. Available at: http://factsanddetails.com/world.php?itemid=1304&catid=52&subcatid=329 (retrieved January 2011).
West, L. Tropical Rainforests: Nature's Medicine Cabinet. http://environment.about.com/od/ healthenvironment/a/rainforest_drug.htm (retrieved January 2011).
The Biomimicry Institute. 2011. Ask Nature. Available at: http://www.asknature.org/product/600e2a50746fa 6339870554b2a7a36fd (retrieved January 2011).
Ackerman, F. 2004. Priceless Benefits, Costly Mistakes: What's Wrong With Cost-Benefit Analysis? Post- autistic economics review. 25 (1) 2-7.
Ackerman, F. and Heinzerling l. 2004. Priceless: On Knowing the Price of Everything and the Value of Nothing.
The New York Press. Pp.277.
Millennium Ecosystems Assessment Synthesis Report. 2005. Ecosystems and Human Well-Being: Synthesis.
Island Press, Washington, DC. Available at: http://www.maweb.org/documents/document.356.aspx.pdf
(retrieved January 2011).
Daly, H. E. and Farley, J. 2004. Ecological Economics: Principles and Applications. Island Press, Washington, DC.
TEEB. 2010. The Economics of Ecosystems and Biodiversity: Mainstreaming the Economics of Nature: A synthesis of the approach, conclusions and recommendations of TEEB. Available at: http://www.teebweb. org/TEEBSynthesisReport/tabid/29410/Default.aspx (retrieved February 2011).
The World Bank. 2010. World Bank Launches New Global Partnership to Green National Accounts. Available at: http://web.worldbank.org/WBSITE/EXTERNAL/NEWS/0,,contentMDK:22746592�pagePK:64257043�piPK: 437376�theSitePK:4607,00.html (retrieved February 2011).
International Institute for Environment and Development. 2002. Breaking New Ground: Mining, Minerals and Sustainable Development. Available at: http://www.iied.org/sustainable-markets/key-issues/business-and- sustainable-development/mmsd-final-report (retrieved January 2011)
USGS Mineral Resources Program. 2009. Mineral Resources External Research Program (MRERP). Available at: http://minerals.usgs.gov/mrerp/2009.html (retrieved January 2011).
International Copper Study Group. 2011. World refined copper production and usage trends. Available at http:www.iscg.org/images/stories/table1.pdf (retrieved July 2011).
USGS Mineral Resources Program. 2003. Mineral Resources External Research Program (MRERP). Available at: http://minerals.usgs.gov/mrerp/2009.html (retrieved January 2011).
Mine-engineer.com. Copper mining info. http://www.mine-engineer.com/mining/copperm.htm (retrieved January 2011).
Taseko Mines Limited. 2009. Building wealth through developing and operating major copper mines.
Available at: http://www.tasekomines.com/tko/NewsReleases.asp?DateRange=2009/01/01...2009/12/31
(retrieved April 2011).
London Metal Exchange. 2011. Available at: http://www.lme.com/who.asp (retrieved March 2011).
iied. 2002. Breaking New Ground, the Report of the Mining, Minerals and Sustainable Development Project.
Earthscan Publications.
QuadraFNX. How Copper is Sold. http://www.quadrafnx.com/s/copper101-howitsold.asp (retrieved January 2011).
Mining Law of Ecuador. 2009. Chapter IV, Articles 92 and 93. Available at: http://www.mineriaecuador.com/ Download/ley_mineriaec.pdf (retrieved March 2011).
Ministerio de Recursos Naturales No Renovables. 2011. Plan Nacional de Desarrollo del Sector Minero 2011- 2015.
La Hora. 2011 Entre 2011 y 2012: Codelco inciara sondajes en proyectos mineros en Ecuador. August 4, 2011.
Mining Law of Ecuador. 2009. Chapter II, Article 34. Available at: http://www.mineriaecuador.com/ Download/ley_mineriaec.pdf (retrieved March 2011).
World Bank. 2005. Global Monitoring Report. Available at: http://siteresources.worldbank.org/ GLOBALMONITORINGEXT/Resources/complete.pdf (retrieved January 2011).
Kirsch, S. 1996. Cleaning Up OK Tedi: Settlement Favors Yonggom People. University of Michigan. 4 (1).
Moran, R. "Mining Environmental Impacts - Integrating and Economic Perspective." No date.
Kuipers. 2000. U.S. House of Representatives.
De Groot, R., Wilson, M.A., Boumans, R.M.J., 2002. Ecosystem functions, goods and services: Classification, description and valuation guidelines. Ecological Economics 41; 393-408.
West, T. O., Post, W. M. 2002. Soil Organic Carbon Sequestration by tillage and Crop Rotation: A Global Data Analysis. Soil Science Society of America Journal 66, 1930-1946.
Tweeten, L. Sohngen, B., Hopkins, J. 1998. Assessing the Economics in Carbon Sequestration in Agriculture.
Available at: http://www.cnr.berkeley.edu/csrd/global/dcconf/pdf/tweeten_co2.pdf (retrieved January
2011).
Inti Chakinan. 2010. Intag Spanish School. Available at: http://www.intichakinan.com/spanishschool_intag_ ecuador.htm (retrieved January 2011).
Konrad, C. P. 2003. Effects of Urban Development on Floods. USGS: Science for a Changing World. Fact Sheet 076-03.
Bell G. 2008. UNICEF- Thousands remain Homeless after Torrential Rains and Flooding in Ecuador. Available at: http://www.unicef.org/infobycountry/ecuador_43459.html (retrieved January 2011).
Meterorologisk institutt. ND. Cordillera de Intag (Ecuador). Available at: http://www.yr.no/place/ Ecuador%2FOther%2FCordillera_de_Intag/statistics.html (retrieved July 2011).
Moore, R. D., Wondzell, S. M. 2005. Physical hydrology and the effects of forest harvesting in the Pacific Northwest: a review. Journal of the American Water resources Association. 41(4): 763-784.
Zorrilla, C. 2011. Healthy Forests Mean Safe Water for Communities in North-Western Ecuador. Tropical Montane Forests. Available at: http://www.infoandina.org/sites/default/files/recursos/watershed_ecuador. pdf (retrieved January 2011).
Mecham, J. 2001. Causes and Consequences of Deforestation in Ecuador. Centro de Investigacion de los Bosques Tropicales. Available at: http://www.rainforestinfo.org.au/projects/jefferson.htm (retrieved January 2011).
Zehetner, F., Miller, W.P., West, L.T. 2003. Pedogenesis of Volcanic Ash Soils in Andean Ecuador. Soil Sci Soc. J.
67:1797-1809. Available at: http://pdf.usaid.gov/pdf_docs/PNACU698.pdf (retrieved January 2011).
Stamets, P. 2005. Mycelium running: How Mushrooms Can Help Save the World. Ten Speed Press, Berkeley CA.
Tanner, E. V. J., Vitousek P. M., Cuevas E. 1998. Experimental Investigation of Nutrient Limitation of Forest Growth on Wet Tropical Mountains. Ecology 79(1), 10-22.
Weslawski, J.M., P.V.R. Snelgrove, L.A. Levin, M.C. Austen, R.T. Kneib, T.M. Iliffe, J.R. Garey, S.J. Hawkins, Whitlatch, R.B., 2004. Marine sedimentary biota as providers of ecosystem goods and services, in: Hall, D.H. (Ed.), Sustaining Biodiversity and Ecosystem Services in Soils and Sediments. Island Press, Washington D.C., Covelo, CA, London.
Garber, J., Collins, Davis, 1992. Impacts of Estuarine Benthic Algal Production on Dissolved Nutrients and Water Quality in Yaquina River Estuary, Oregon. Water Resources Research Institute- Oregon State University, Corvalis, OR.
Cornejo, F. H., Varel A., Wright S. J. 1994. Tropical forest letter decomposition under seasonal drought: nutrient release, fungi and bacteria. Oikos 70, 183-290.
Pimentel, D. 1998. Benefits of biological diversity in the state of Maryland. Ithica, NY: Cornell University, College of Agricultural and Life Sciences.
Zorrilla, C. 2004. Healthy forests mean safe water for communities in North-Western Ecuador. The Rufford Foundation, O2.
Zorrilla, C. 2010. News Update. DECOIN. Available at: http://www.decoin.org/2010/04/news-update-on- other-things-besides-mining-well-almost/ (retrieved January 2011).
Risch, S.J., Andow, D., Altieri, M.A., 1983. Agroecosystem Diversity and Pest Control: Data, Tentative Conclusions, and New Research Directions Environmental Entomology 12, 625-629.
Buchmann, S. L., Nabhan G. P. 1997. The Forgotten Pollinators. International and Pan-American, Washington DC.
FAO.2008. Rapid Assessment of Pollinators' Status: A Contribution to the International Initiative for the Conservation and Sustainable Use of Pollinators. Available at: http://www.fao.org/fileadmin/user_upload/ agp/raps_1.pdf (retrieved January 2011).
Ricketts, T.W. 2004. Economic value of wild pollinators to coffee crops 1stRAPS Case study.
Fries, R., Marcela, C., Douglas P., Rodriguez, A. 2006. Nature Oriented Tourism in Ecuador: An Assessment
Applying the Value Chain and Nature, Wealth and Power Frameworks. U.S. AID. Available at: http://pdf.usaid. gov/pdf_docs/PNADH791.pdf (retrieved January 2011).
Myers, N., Mittermeier, R.A., Mittermeier, C.G., da Fonseca, G. A. B., Kent, J. 2000. Biodiversity hotspots for conservation priorities. Nature 403 (335) 853-858.
CNRH. 2002 Gesti6n de los Recursos Hidricos del Ecuador - Politicas Estrategias. Documento Basico - Revisi6n 2 - Concepts Adicionales. Ecuador - Consejo National de Recursos Hidricos (CNRH).
Espinosa, C. 2005. Payment for Water-Based Environmental Services: Ecuador's Experiences, Lessons Learned and Ways Forward. IUCN Technical Paper No. 2. Colombo: IUCN.
Syvitski, J. P. M., Vorosmarty, C. J., Green, P. 2005. Impact of Humans on the Flux of Terrestrial Sediment to the Global Coastal Ocean. Science. 308 (5720) 376-380.
Alban M., Wunder S. 2005. Decentralized Payments for Environmental Services: Comparing the Cases of Pimampiro and PROFAFOR in Ecuador. Available at: http://www.zef.de/fileadmin/webfiles/downloads/ projects/devcom/PES_workshop_files/Case_study_Ecuador.pdf (retrieved January 2011).
Watershed Markets. 2006. Ecuador-Pedro Moncayo- Reforestation and Management of the Mojanda Micro Valleys. Available at: http://www.watershedmarkets.org/casestudies/Ecuador_Pedro_Moncayo_E.html (retrieved January 2011).
Sangarun, P., Srisang, W., Jaroensutasinee, K. and Jaroensutasine, M. 2007. Cloud Forest Characteristics of Khao Nan, Thailand. World Academy of Science, Engineering and Technology.
Lawton. R.O., Nair, U. S., Pielke Sr. R. A., Welch, R. M. 2001. Climatic Impact of Tropical Lowland Deforestation on Nearby Montane Cloud Forests. Science. 294 (5542) 584-587.
Power, T.M. 1996. Lost Landscapes and Failed Economies. Island Press, Washington, D.C., Covelo, CA, and London.
Castellanos, A. 2010. Andean bear home ranges in the Intag region, Ecuador. Ursus 22:65-73. BioOne
Peck M. 2008. Developing a Species and Habitat Action Plan: Focusing conservation efforts for the brown- headed spider monkey (Ateles fusciceps) using remote sensing, predictive distribution modelling and playback field survey. Available at: http://www.primenet.org.uk/Documents/Remote%20sensing%20report. pdf (retrieved January 2011).
Mongabay. ND. Medicinal Plants. Available at: http://rainforests.mongabay.com/1007.htm (retrieved January 2011).
Plotkin, M.J. 2000. Medince Quest: In Search of Nature's Healing Secrets.
Faegan, Z. 2009. Sangre De Drago is a Medical Powerhouse. Available at: http://naturalnews.com/ (retrieved January 2011).
Daily, G. C., Alexander, S., Ehrlich, P. R., Goulder, L., Lubchenco, J., Matson, P. A., Mooney, H. A., Postel, S., Schneider, S. H., Tilman, D., Woodwell, G. M. 1997. Ecosystem Services: Benefits Supplied to human societies by natural ecosystems. Issue in Ecology 2:2-16.
Medio Ambiente OK. 2009. Expo Universal de Orquideas en Ecuador, el termometro de la salud ambiental del planeta. Available at: http://medioambienteok.blogspot.com/2009/02/expo-universal-de-orquideas-en- ecuador.html (retrieved January 2011).
El Mundo de las Orquideas. ND. La exportacion de orquideas va viento en popa. Available at: http://solo- orquideas.blogspot.com/2010/08/la-exportacion-de-orquideas-va-viento.html (retrieved January 2011).
Lideres. 2008. La Diversidad es la Fuerza e la Orquidea. Available at: http://www.revistalideres.ec/2010-06- 28/Mercados/Analisis-Sectorial/LD100628P17ENPERSPECTIVA.aspx (retrieved February 2011).
Hoy. 2011. Bella especie de exportacion. Available at: http://www.hoy.com.ec/noticias-ecuador/orquidea- nacional-florece-en-el-mundo-323792.html (retrieved January 2011).
Colinvaux P.A., Olson K., Liu K. 1988. Late-glacial and holocene pollen diagrams from two endorheic lakes of the inte-andean plateau of Ecuador. Review of Palaeobotany and Palynology, 55 (1-3), pp. 83-99.
The Guardian. 2011. Your Chance to Save Ecuador's Rainforests. Available at: http://www.guardian.co.uk/ world/2011/jul/17/your-chance-save-ecuador-rainforest (retrieved July 2011).
Norgaard, R., Costanza, R., Cumberland, J., Daly, H., Goodland, R., 2007. An Introduction to Ecological Economics. In: Encyclopedia of Earth. Eds. Cutler J. Cleveland (Washington, D.C.: Environmental Information Coalition, National Council for Science and the Environment). [First published in the Encyclopedia of Earth August 9, 2007; Last revised July 20, 2007. Available at: http://www.eoearth.org/ article/An_Introduction_ to_Ecological_Economics_(e-book) (retrieved November 2010).
United Nations Environment Program. 2005. The Millennium Ecosystem Assessment. Ecosystems and Human Well-being: Current Status and Trends, Volume 1. R. Hassan, R. Scholes, and N. Ash, eds. Island Press, Washington D.C., Covelo, CA, and London.
Vitousek, P.M., Ehrlich, P.R., Ehrlich, A.H., Matson, P.A., 1986. Human Appropriation of the Products of Photosynthesis. BioScience 34, 368-373.
Haberl, H., Erb, K.H., Krausmann, F., Gaube, V., Bondeau, A., Plutzar, C., Gingrich, S., Lucht, W., Fischer- Kowalski, M., 2007. Quantifying and mapping the human appropriation of net primary production in earth's terrestrial ecosystems. Proceedings of the National Academy of Sciences of the United States of America 104; 12942-12947.
Farley, L. 2009. Conservation Through Economics Lens. Environmental Management 22, 1399-1408.
Costanza, R., Waigner, L., Folke, C., Maler, K. 1993. Modeling Complez Systems. Bioscience 43, 545-555.
Gunderson, L.H., Holling, C.S., 2002. Resilience and adaptive cycles, in: Gunderson, L.H., Holling, C.S. (Eds.), 2002. Panarchy: understanding transformations in human and natural systems. Island Press, Washington DC.
United Nations Environment Program. 2010. Green Economy Success Stories: Ecosystem Services in Ecuador. Available at: http://www.unep.org/greeneconomy/SuccessStories/EcosystemServicesinEcuador/ tabid/4714/language/en-US/Default.aspx (retrieved January 2011).
Daily. G. C. (Eds.) 1997. Nature's Services: Societal Dependence on Natural Ecosystems. Island Press, Washington, DC.
Costanza, R., d'Arge, R., de Groot, R., Farber, S., Grasso, M., Hannon, B., Limburg, K., Naeem, S., O'Neill, R.V., Paruelo, J., Raskin, R.G., Sutton, P., van den Belt, M., 1997. The value of the world's ecosystem services and natural capital. Nature 387, 253-260.; Daily, G.C. (Eds.), 1997. Nature's Services: Societal Dependence on Natural Ecosystems. Island Press, Washington, D.C.
Howarth, B. H., Farber, S. 2002. Accounting for the Value of Ecosystem Services. Ecological Economics. 41, 421-429.
Boumans, R., Costanza, R., Farley, J., Wilson, M. A., Portela, R., Rotmans, J., Villa, F., Grasso, M. 2002.
Modeling the dynamics of the integrated Earth system and the value of global ecosystem services using the
GUMBO model. Ecological Economics 41; 529-560.
Limburg, K.E., O'Neill, R.V., Costanza, R., Farber, S., 2002. Complex systems and valuation. Ecological Economics 41; 409-420.

Earth Economics
1121 Tacoma Avenue South
Tacoma, WA 98402
253.539.4801